| Red | Green | Blue | |
| z | 17.64 | ||
| znorm | Inf | ||
| sky | -Inf | -Inf | -Inf |
| S/N | 30.0 | 51.6 | 54.8 |
| S/N(c) | 0.0 | 0.0 | 0.0 |
| SN(E/C) |
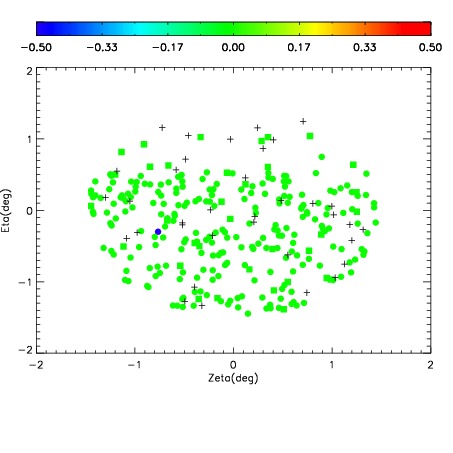
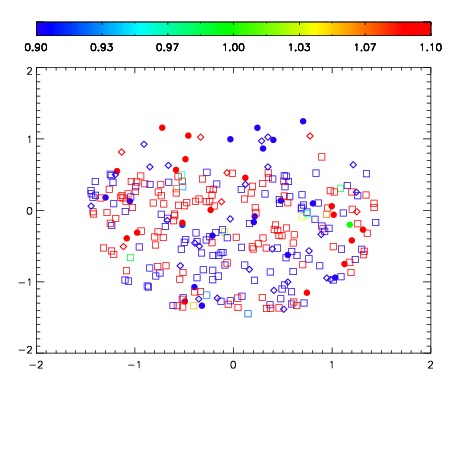
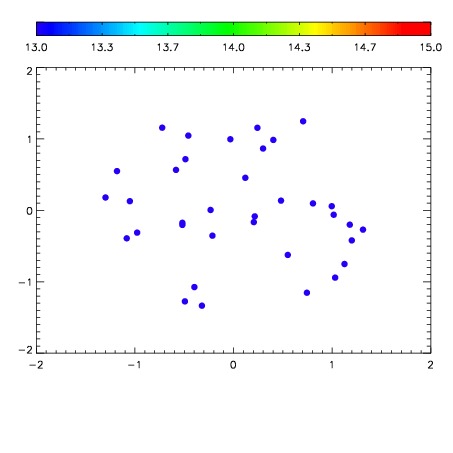

| Frame | Nreads | Zeropoints | Mag plots | Spatial mag deviation | Spatial sky 16325A emission deviations (filled: sky, open: star) | Spatial sky continuum emission | Spatial sky telluric CO2 absorption deviations (filled: H < 10) | |||||||||||||||||||||||
| 0 | 0 |
|
|
|
|
|
|
| IPAIR | NAME | SHIFT | NEWSHIFT | S/N | NAME | SHIFT | NEWSHIFT | S/N |
| 0 | 03750061 | 0.509088 | 0.00000 | 19.1305 | 03750062 | 0.00211944 | 0.506969 | 19.0655 |
| 1 | 03750056 | 0.504963 | 0.00412500 | 19.1992 | 03750058 | 0.00341066 | 0.505677 | 19.1910 |
| 2 | 03750057 | 0.507774 | 0.00131398 | 19.1719 | 03750055 | 0.00000 | 0.509088 | 19.1622 |
| 3 | 03750060 | 0.503751 | 0.00533700 | 19.1325 | 03750059 | 0.00219059 | 0.506897 | 19.1420 |