| Red | Green | Blue | |
| z | 17.64 | ||
| znorm | Inf | ||
| sky | -Inf | -NaN | -Inf |
| S/N | 11.2 | 19.8 | 22.0 |
| S/N(c) | 0.0 | 0.0 | 0.0 |
| SN(E/C) |
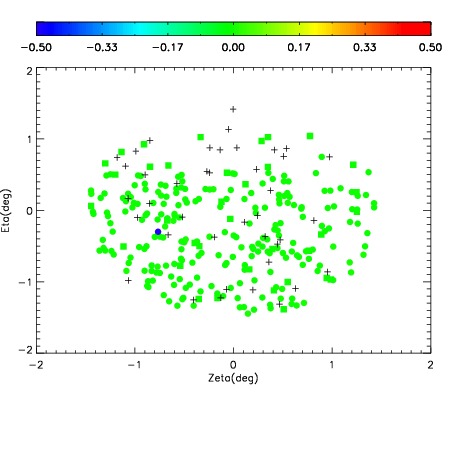
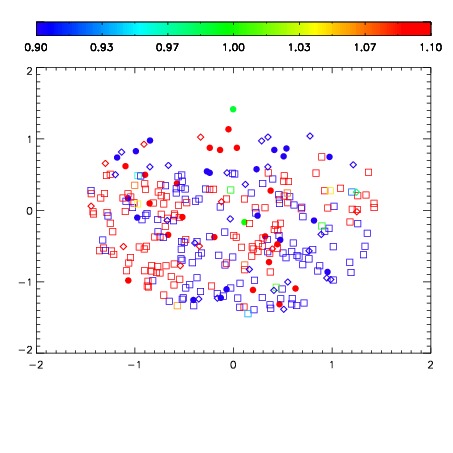
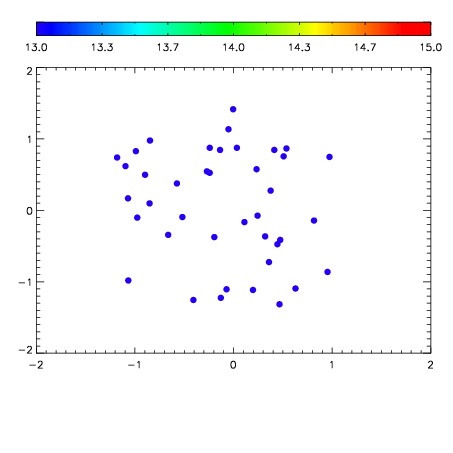

| Frame | Nreads | Zeropoints | Mag plots | Spatial mag deviation | Spatial sky 16325A emission deviations (filled: sky, open: star) | Spatial sky continuum emission | Spatial sky telluric CO2 absorption deviations (filled: H < 10) | |||||||||||||||||||||||
| 0 | 0 |
|
|
|
|
|
|
| IPAIR | NAME | SHIFT | NEWSHIFT | S/N | NAME | SHIFT | NEWSHIFT | S/N |
| 0 | 03140079 | 0.514681 | 0.00000 | 17.8774 | 03140076 | 0.00543567 | 0.509245 | 18.3365 |
| 1 | 03140078 | 0.512026 | 0.00265497 | 18.2377 | 03140077 | 0.00809683 | 0.506584 | 18.3680 |
| 2 | 03140075 | 0.513829 | 0.000851989 | 17.6334 | 03140080 | 0.00626957 | 0.508411 | 17.9038 |
| 3 | 03140074 | 0.511859 | 0.00282198 | 17.0997 | 03140073 | 0.00000 | 0.514681 | 16.9920 |