| Red | Green | Blue | |
| z | 17.64 | ||
| znorm | Inf | ||
| sky | -Inf | -NaN | -Inf |
| S/N | 29.0 | 49.2 | 54.6 |
| S/N(c) | 0.0 | 0.0 | 0.0 |
| SN(E/C) |
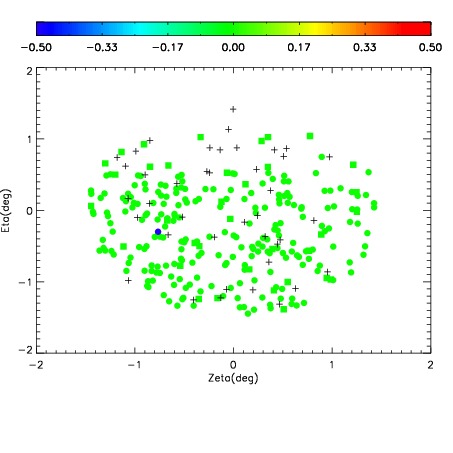
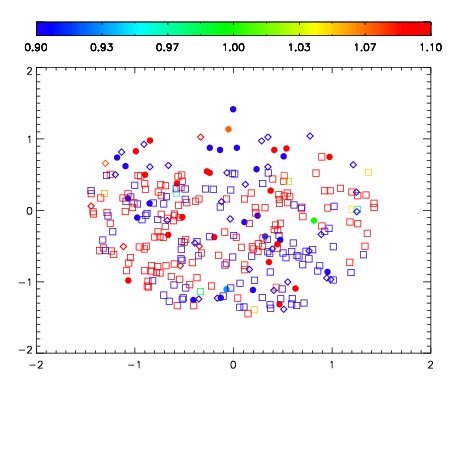
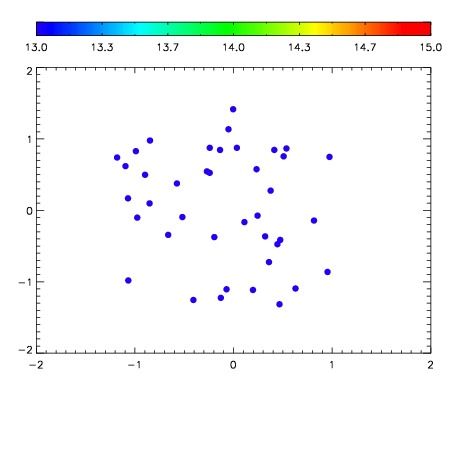

| Frame | Nreads | Zeropoints | Mag plots | Spatial mag deviation | Spatial sky 16325A emission deviations (filled: sky, open: star) | Spatial sky continuum emission | Spatial sky telluric CO2 absorption deviations (filled: H < 10) | |||||||||||||||||||||||
| 0 | 0 |
|
|
|
|
|
|
| IPAIR | NAME | SHIFT | NEWSHIFT | S/N | NAME | SHIFT | NEWSHIFT | S/N |
| 0 | 03780012 | 0.503988 | 0.00000 | 19.0552 | 03780010 | 0.00000 | 0.503988 | 19.0630 |
| 1 | 03780015 | 0.501680 | 0.00230801 | 19.1628 | 03780017 | 0.000153149 | 0.503835 | 19.1080 |
| 2 | 03780016 | 0.502252 | 0.00173604 | 19.1098 | 03780013 | 0.00135434 | 0.502634 | 19.0943 |
| 3 | 03780011 | 0.503267 | 0.000721037 | 19.0226 | 03780014 | -0.00316148 | 0.507150 | 19.0509 |