| Red | Green | Blue | |
| z | 17.64 | ||
| znorm | Inf | ||
| sky | -Inf | -Inf | -Inf |
| S/N | 24.2 | 42.5 | 44.5 |
| S/N(c) | 0.0 | 0.0 | 0.0 |
| SN(E/C) |
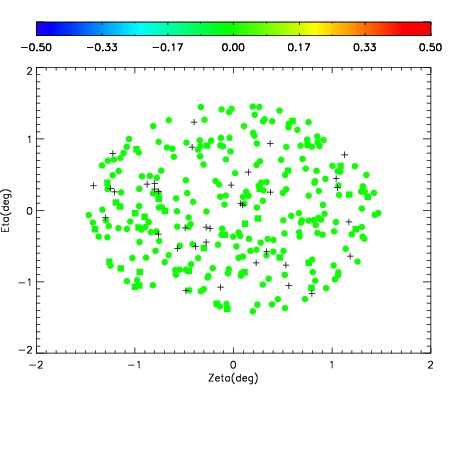
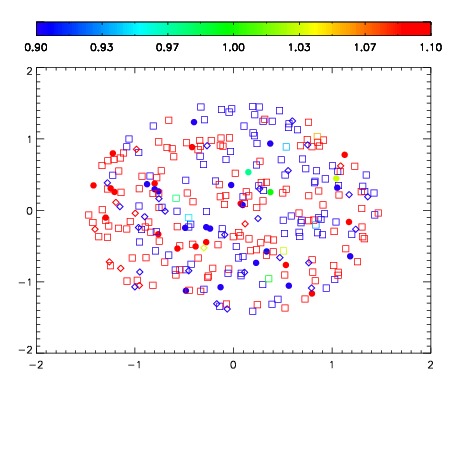
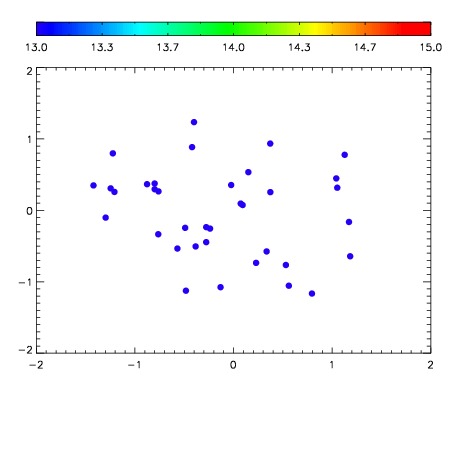

| Frame | Nreads | Zeropoints | Mag plots | Spatial mag deviation | Spatial sky 16325A emission deviations (filled: sky, open: star) | Spatial sky continuum emission | Spatial sky telluric CO2 absorption deviations (filled: H < 10) | |||||||||||||||||||||||
| 0 | 0 |
|
|
|
|
|
|
| IPAIR | NAME | SHIFT | NEWSHIFT | S/N | NAME | SHIFT | NEWSHIFT | S/N |
| 0 | 02860103 | 0.410892 | 0.00000 | 19.0220 | 02860104 | 0.00316431 | 0.407728 | 19.0523 |
| 1 | 02860102 | 0.409118 | 0.00177401 | 19.0579 | 02860101 | 0.00000 | 0.410892 | 19.0680 |
| 2 | 02860107 | 0.410174 | 0.000717998 | 19.0063 | 02860105 | 0.00226654 | 0.408625 | 19.0255 |
| 3 | 02860106 | 0.409024 | 0.00186801 | 18.9835 | 02860108 | 0.00368202 | 0.407210 | 18.7337 |