| Red | Green | Blue | |
| z | 17.64 | ||
| znorm | Inf | ||
| sky | -Inf | -Inf | -Inf |
| S/N | 25.4 | 44.7 | 45.9 |
| S/N(c) | 0.0 | 0.0 | 0.0 |
| SN(E/C) |
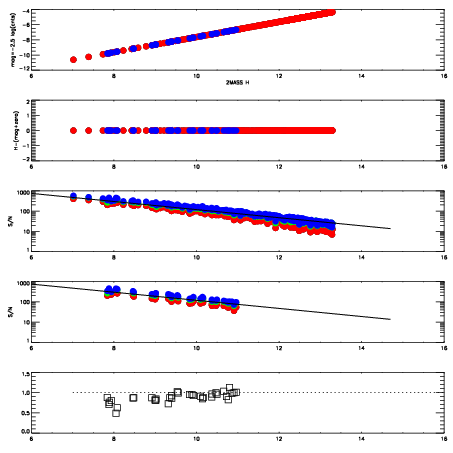
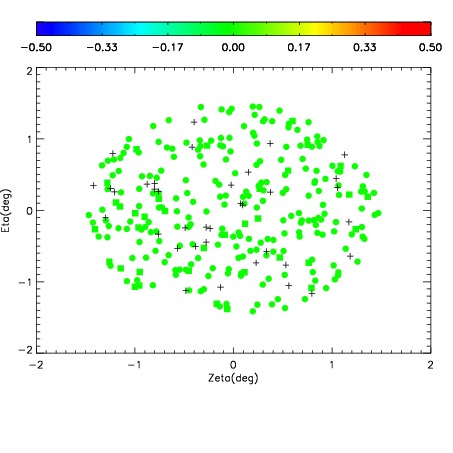
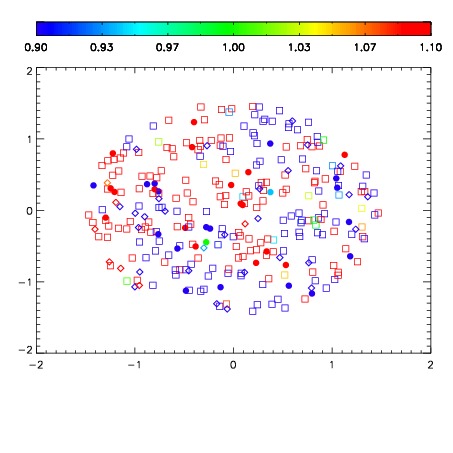
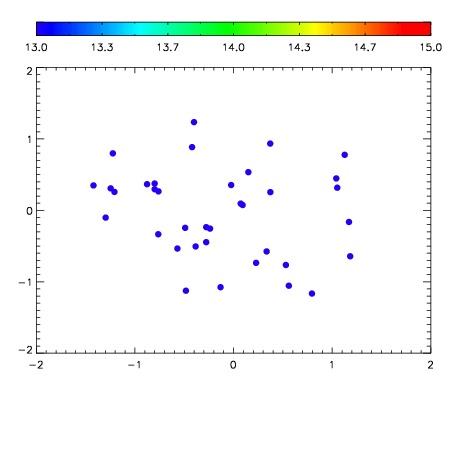

| Frame | Nreads | Zeropoints | Mag plots | Spatial mag deviation | Spatial sky 16325A emission deviations (filled: sky, open: star) | Spatial sky continuum emission | Spatial sky telluric CO2 absorption deviations (filled: H < 10) | |||||||||||||||||||||||
| 0 | 0 |
|
|
|
|
|
|
| IPAIR | NAME | SHIFT | NEWSHIFT | S/N | NAME | SHIFT | NEWSHIFT | S/N |
| 0 | 03120079 | 0.495374 | 0.00000 | 18.7987 | 03120080 | 0.00423340 | 0.491141 | 19.0333 |
| 1 | 03120074 | 0.493744 | 0.00163001 | 19.1153 | 03120073 | 0.00000 | 0.495374 | 19.1047 |
| 2 | 03120075 | 0.494545 | 0.000828981 | 19.0946 | 03120076 | -0.000198820 | 0.495573 | 19.0641 |
| 3 | 03120078 | 0.493429 | 0.00194499 | 18.7834 | 03120077 | -0.000646097 | 0.496020 | 18.8615 |