| Red | Green | Blue | |
| z | 17.64 | ||
| znorm | Inf | ||
| sky | -Inf | -NaN | -Inf |
| S/N | 31.5 | 55.4 | 58.1 |
| S/N(c) | 0.0 | 0.0 | 0.0 |
| SN(E/C) |
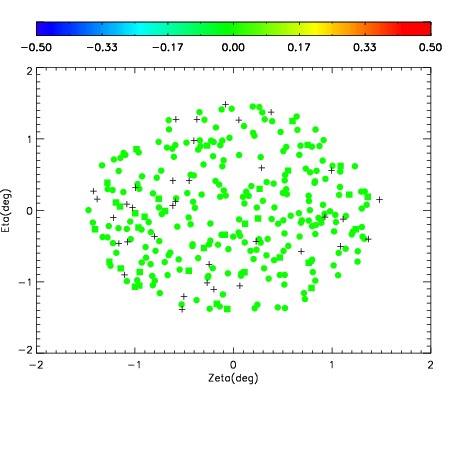
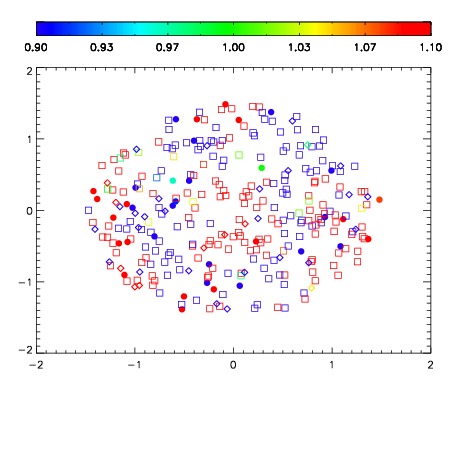
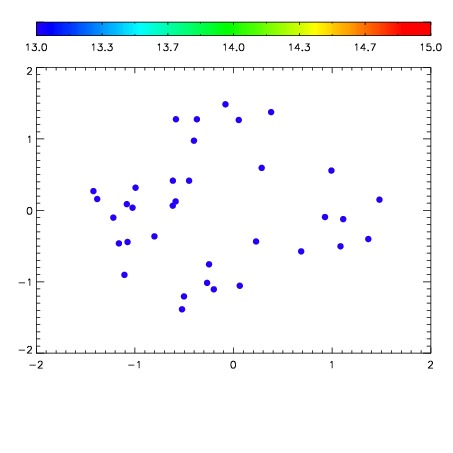

| Frame | Nreads | Zeropoints | Mag plots | Spatial mag deviation | Spatial sky 16325A emission deviations (filled: sky, open: star) | Spatial sky continuum emission | Spatial sky telluric CO2 absorption deviations (filled: H < 10) | |||||||||||||||||||||||
| 0 | 0 |
|
|
|
|
|
|
| IPAIR | NAME | SHIFT | NEWSHIFT | S/N | NAME | SHIFT | NEWSHIFT | S/N |
| 0 | 02810051 | 0.416100 | 0.00000 | 18.8771 | 02810049 | 0.00000 | 0.416100 | 18.8222 |
| 1 | 02810062 | 0.409475 | 0.00662500 | 18.9150 | 02810052 | -0.000938894 | 0.417039 | 18.8649 |
| 2 | 02810059 | 0.410357 | 0.00574300 | 18.8994 | 02810053 | -0.00251416 | 0.418614 | 18.8346 |
| 3 | 02810058 | 0.409121 | 0.00697899 | 18.8862 | 02810057 | -0.00343849 | 0.419538 | 18.8314 |
| 4 | 02810055 | 0.413329 | 0.00277099 | 18.8571 | 02810056 | -0.000783748 | 0.416884 | 18.8164 |
| 5 | 02810050 | 0.411845 | 0.00425500 | 18.8339 | 02810061 | -0.00278652 | 0.418887 | 18.7885 |
| 6 | 02810063 | 0.411119 | 0.00498098 | 18.8093 | 02810064 | -0.00214778 | 0.418248 | 18.7806 |
| 7 | 02810054 | 0.410603 | 0.00549701 | 18.8001 | 02810060 | -0.00104940 | 0.417149 | 18.7439 |