| Red | Green | Blue | |
| z | 17.64 | ||
| znorm | Inf | ||
| sky | -Inf | -Inf | -Inf |
| S/N | 26.1 | 43.9 | 47.4 |
| S/N(c) | 0.0 | 0.0 | 0.0 |
| SN(E/C) |
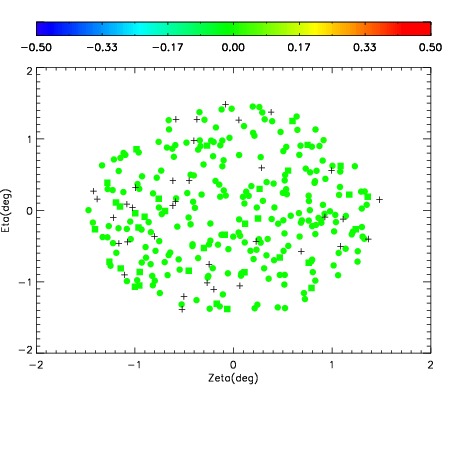
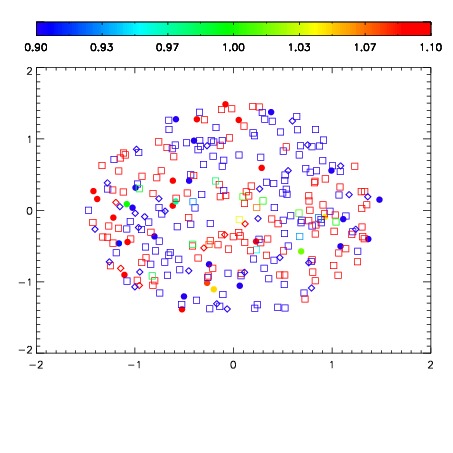
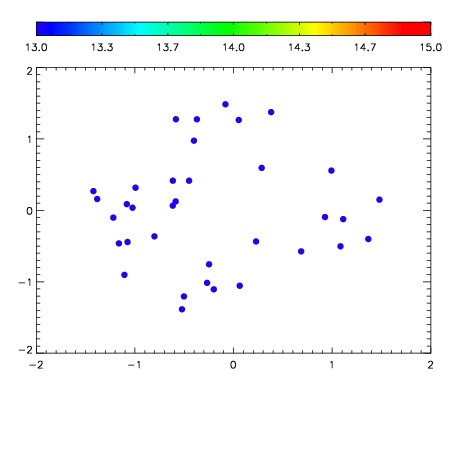

| Frame | Nreads | Zeropoints | Mag plots | Spatial mag deviation | Spatial sky 16325A emission deviations (filled: sky, open: star) | Spatial sky continuum emission | Spatial sky telluric CO2 absorption deviations (filled: H < 10) | |||||||||||||||||||||||
| 0 | 0 |
|
|
|
|
|
|
| IPAIR | NAME | SHIFT | NEWSHIFT | S/N | NAME | SHIFT | NEWSHIFT | S/N |
| 0 | 02820085 | 0.421271 | 0.00000 | 19.0880 | 02820083 | 0.00384437 | 0.417427 | 19.0378 |
| 1 | 02820084 | 0.418682 | 0.00258899 | 19.0915 | 02820082 | 0.00536664 | 0.415904 | 19.0927 |
| 2 | 02820081 | 0.415921 | 0.00534999 | 19.0681 | 02820079 | 0.00000 | 0.421271 | 19.0075 |
| 3 | 02820080 | 0.415186 | 0.00608501 | 19.0452 | 02820086 | 0.00645828 | 0.414813 | 19.0004 |