| Red | Green | Blue | |
| z | 17.64 | ||
| znorm | Inf | ||
| sky | -Inf | -Inf | -Inf |
| S/N | 20.9 | 37.5 | 39.3 |
| S/N(c) | 0.0 | 0.0 | 0.0 |
| SN(E/C) |
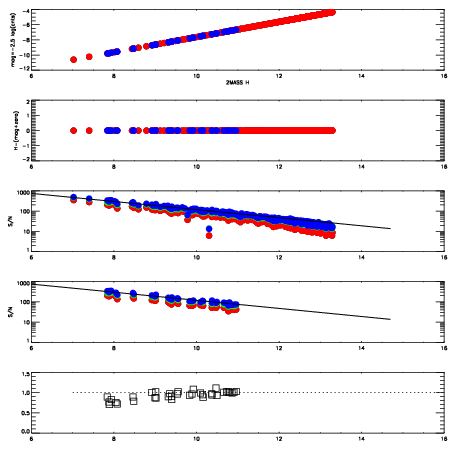
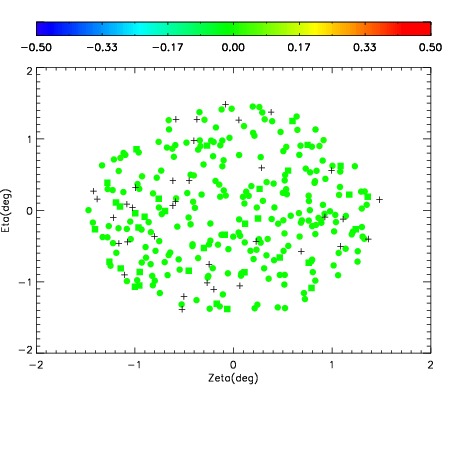
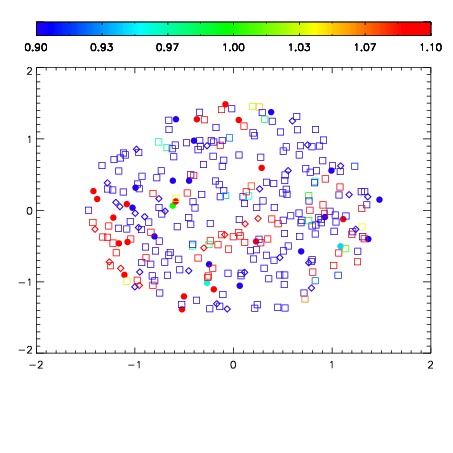
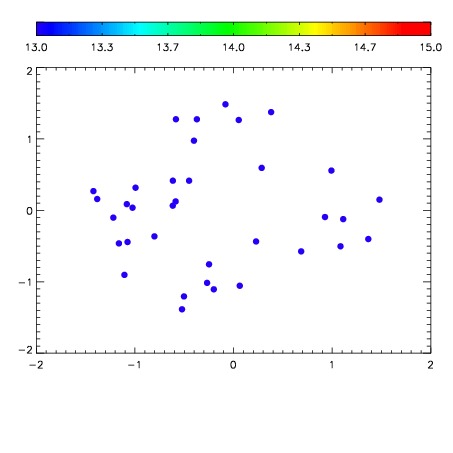

| Frame | Nreads | Zeropoints | Mag plots | Spatial mag deviation | Spatial sky 16325A emission deviations (filled: sky, open: star) | Spatial sky continuum emission | Spatial sky telluric CO2 absorption deviations (filled: H < 10) | |||||||||||||||||||||||
| 0 | 0 |
|
|
|
|
|
|
| IPAIR | NAME | SHIFT | NEWSHIFT | S/N | NAME | SHIFT | NEWSHIFT | S/N |
| 0 | 02830087 | 0.412403 | 0.00000 | 16.5493 | 02830088 | 0.00114102 | 0.411262 | 15.3109 |
| 1 | 02830083 | 0.410812 | 0.00159100 | 19.1332 | 02830081 | 0.00000 | 0.412403 | 19.0179 |
| 2 | 02830082 | 0.408762 | 0.00364098 | 19.0480 | 02830084 | 0.000449424 | 0.411954 | 18.9756 |
| 3 | 02830086 | 0.410170 | 0.00223300 | 17.7609 | 02830085 | -0.000356477 | 0.412759 | 18.5495 |