| Red | Green | Blue | |
| z | 17.64 | ||
| znorm | Inf | ||
| sky | -NaN | -NaN | -Inf |
| S/N | 24.4 | 43.3 | 45.7 |
| S/N(c) | 0.0 | 0.0 | 0.0 |
| SN(E/C) |
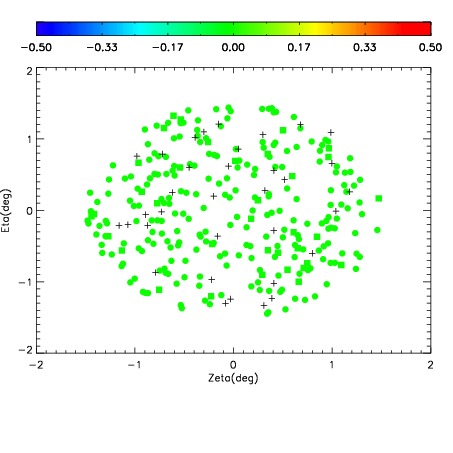
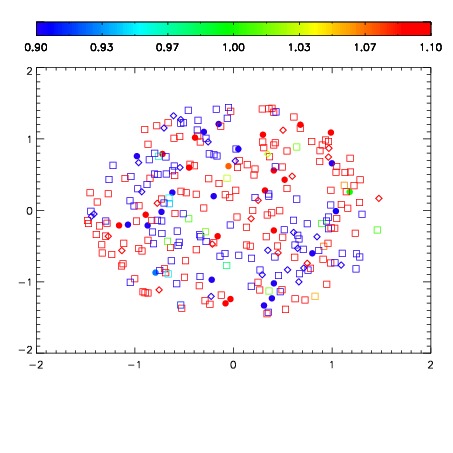
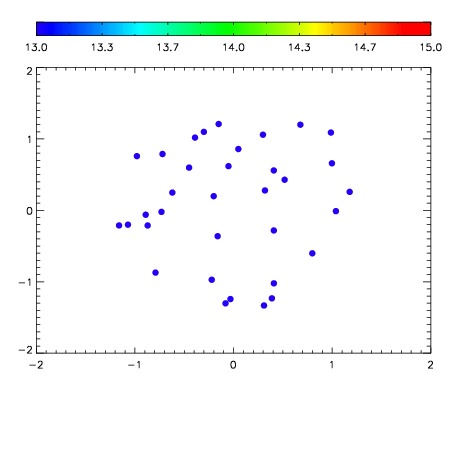

| Frame | Nreads | Zeropoints | Mag plots | Spatial mag deviation | Spatial sky 16325A emission deviations (filled: sky, open: star) | Spatial sky continuum emission | Spatial sky telluric CO2 absorption deviations (filled: H < 10) | |||||||||||||||||||||||
| 0 | 0 |
|
|
|
|
|
|
| IPAIR | NAME | SHIFT | NEWSHIFT | S/N | NAME | SHIFT | NEWSHIFT | S/N |
| 0 | 02900071 | 0.400350 | 0.00000 | 18.9574 | 02900072 | 0.00112428 | 0.399226 | 18.9824 |
| 1 | 02900070 | 0.398370 | 0.00198001 | 19.0147 | 02900069 | 0.00000 | 0.400350 | 19.0129 |
| 2 | 02900074 | 0.398821 | 0.00152901 | 18.8971 | 02900076 | 0.000947194 | 0.399403 | 18.8561 |
| 3 | 02900075 | 0.400246 | 0.000104010 | 18.8504 | 02900073 | -0.000155152 | 0.400505 | 18.8526 |