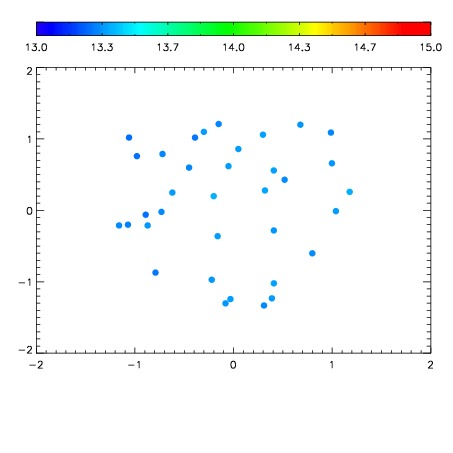
| Frame | Nreads | Zeropoints | Mag plots
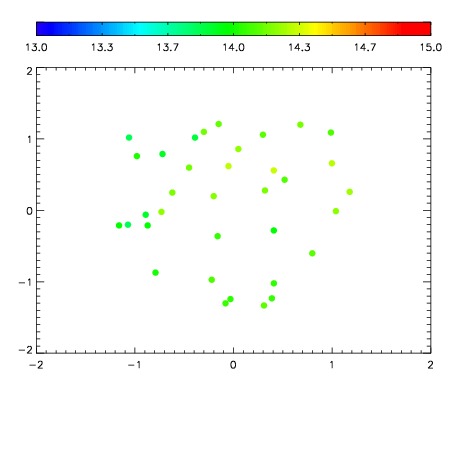
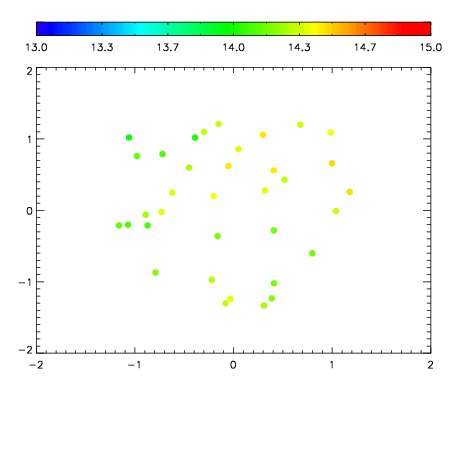
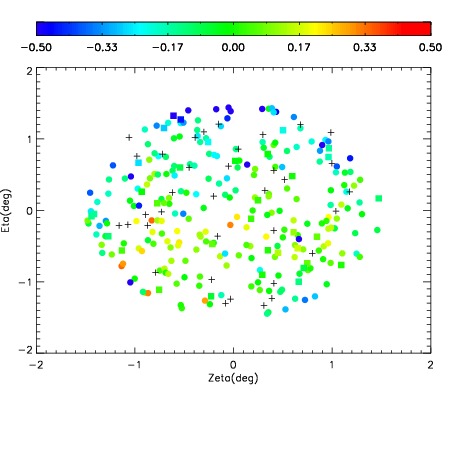
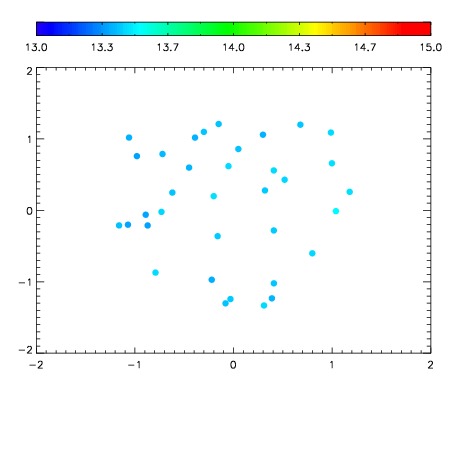
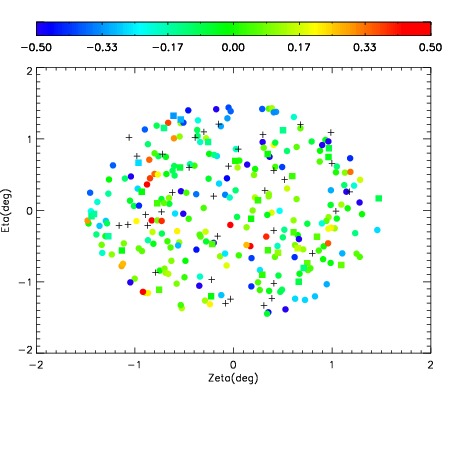
| Spatial mag deviation
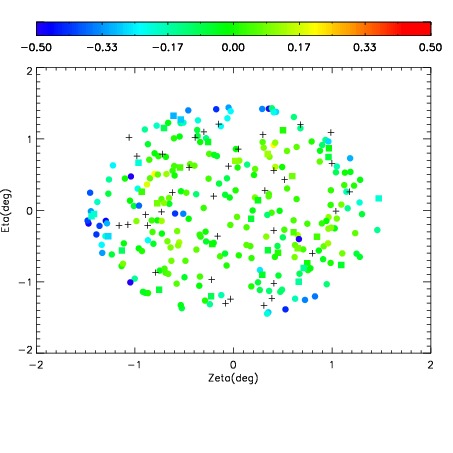
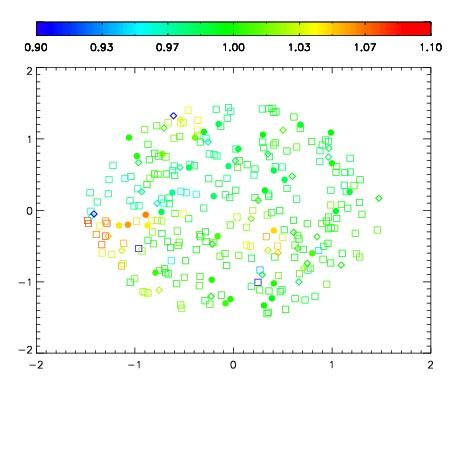
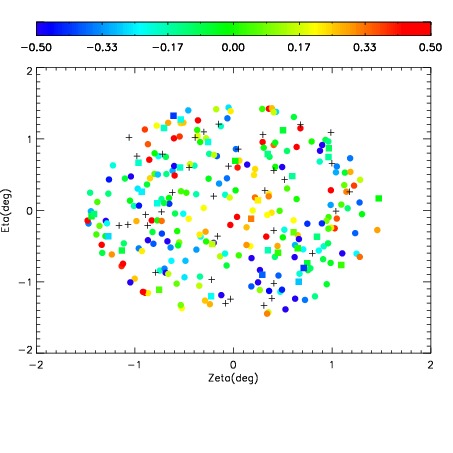
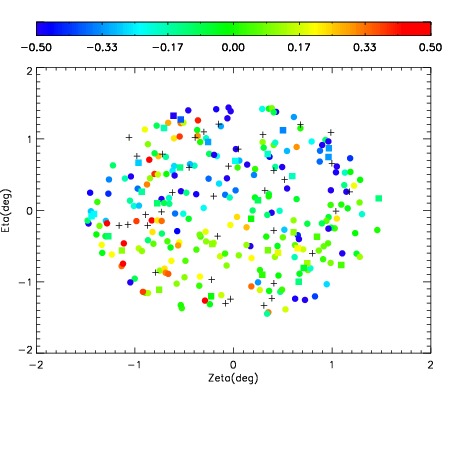
| Spatial sky 16325A emission deviations (filled: sky, open: star)
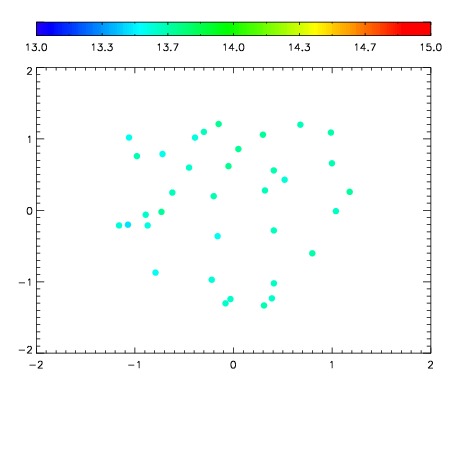
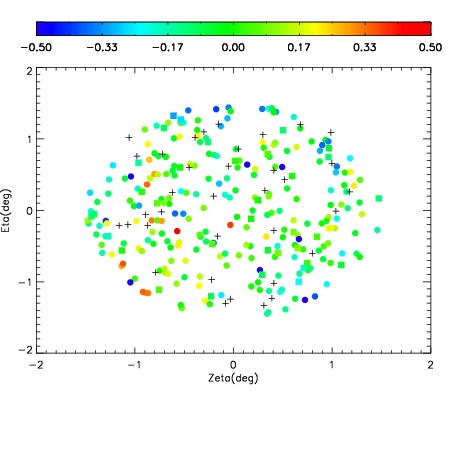
| Spatial sky continuum emission
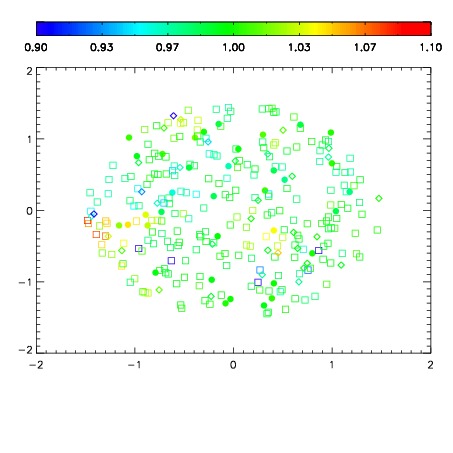
| Spatial sky telluric CO2 absorption deviations (filled: H < 10)
|
| 3120084
| 47
| | Red | Green | Blue
| | z | | 18.37
| | znorm | | 14.19
| | sky | 14.3 | 14.1 | 14.2
| | S/N | 8.9 | 15.9 | 17.0
| | S/N(c) | 9.1 | 7.6 | 14.2
| | SN(E/C) 1.03
|
| 
| 
| 
| 
| 
|
| 3120085
| 47
| | Red | Green | Blue
| | z | | 18.58
| | znorm | | 14.40
| | sky | 14.6 | 14.3 | 14.5
| | S/N | 11.0 | 18.6 | 20.5
| | S/N(c) | 10.7 | 8.7 | 16.3
| | SN(E/C) 1.00
|
| 
| 
| 
| 
| 
|
| 3120086
| 47
| | Red | Green | Blue
| | z | | 17.47
| | znorm | | 13.29
| | sky | 13.8 | 13.6 | 13.8
| | S/N | 4.1 | 8.1 | 8.5
| | S/N(c) | 4.6 | 4.3 | 8.5
| | SN(E/C) 1.02
|
| 
| 
| 
| 
| 
|
| 3120087
| 47
| | Red | Green | Blue
| | z | | 16.84
| | znorm | | 12.66
| | sky | 13.7 | 13.6 | 13.8
| | S/N | 2.4 | 4.9 | 5.1
| | S/N(c) | 2.9 | 3.0 | 5.8
| | SN(E/C) 1.05
|
| 
| 
| 
| 
| 
|
| 3120088
| 47
| | Red | Green | Blue
| | z | | 16.47
| | znorm | | 12.29
| | sky | 13.5 | 13.4 | 13.5
| | S/N | 1.7 | 3.5 | 3.8
| | S/N(c) | 2.1 | 2.2 | 4.5
| | SN(E/C) 1.02
|
| 
| 
| 
| 
| 
|
| 3120089
| 47
| | Red | Green | Blue
| | z | | 15.53
| | znorm | | 11.35
| | sky | 13.4 | 13.4 | 13.5
| | S/N | 0.4 | 1.5 | 1.5
| | S/N(c) | 0.0 | 0.0 | 0.0
| | SN(E/C) 1.46
|
| 
| 
| 
| 
| 
|
| 3120090
| 47
| | Red | Green | Blue
| | z | | 15.91
| | znorm | | 11.73
| | sky | 13.4 | 13.3 | 13.4
| | S/N | 1.0 | 2.1 | 2.2
| | S/N(c) | 0.0 | 0.0 | 0.0
| | SN(E/C) 1.31
|
| 
| 
| 
| 
| 
|
| 3120091
| 47
| | Red | Green | Blue
| | z | | 15.59
| | znorm | | 11.41
| | sky | 13.4 | 13.4 | 13.4
| | S/N | 0.8 | 1.6 | 1.5
| | S/N(c) | 0.0 | 0.0 | 0.0
| | SN(E/C) 1.56
|
| 
| 
| 
| 
| 
|