| Red | Green | Blue | |
| z | 17.64 | ||
| znorm | Inf | ||
| sky | -NaN | -NaN | -NaN |
| S/N | 21.6 | 38.3 | 39.4 |
| S/N(c) | 0.0 | 0.0 | 0.0 |
| SN(E/C) |
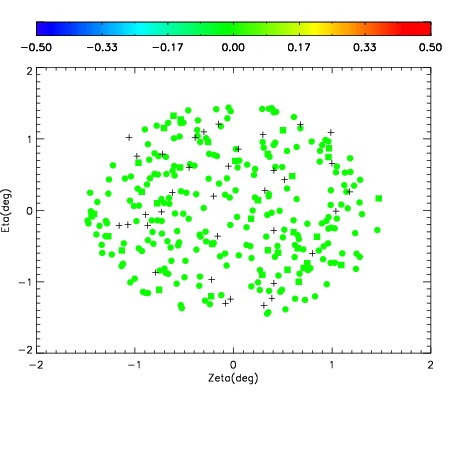
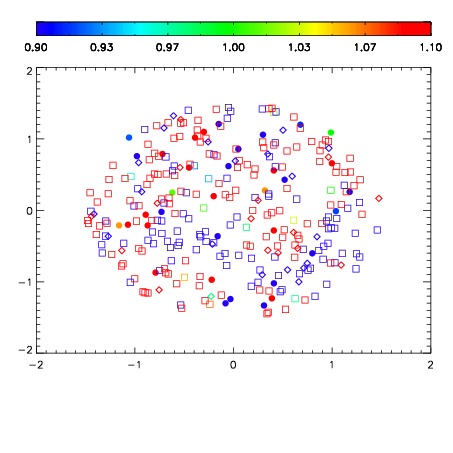
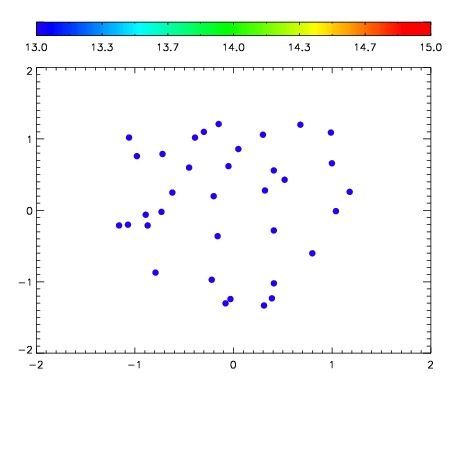

| Frame | Nreads | Zeropoints | Mag plots | Spatial mag deviation | Spatial sky 16325A emission deviations (filled: sky, open: star) | Spatial sky continuum emission | Spatial sky telluric CO2 absorption deviations (filled: H < 10) | |||||||||||||||||||||||
| 0 | 0 |
|
|
|
|
|
|
| IPAIR | NAME | SHIFT | NEWSHIFT | S/N | NAME | SHIFT | NEWSHIFT | S/N |
| 0 | 03210046 | 0.510721 | 0.00000 | 18.1996 | 03210047 | 0.00113504 | 0.509586 | 18.0645 |
| 1 | 03210042 | 0.510383 | 0.000338018 | 19.0102 | 03210040 | 0.00000 | 0.510721 | 19.1058 |
| 2 | 03210041 | 0.503158 | 0.00756305 | 18.6992 | 03210043 | 0.00130318 | 0.509418 | 18.9277 |
| 3 | 03210045 | 0.502410 | 0.00831103 | 18.5960 | 03210044 | 4.03272e-05 | 0.510681 | 18.8320 |