| Red | Green | Blue | |
| z | 17.64 | ||
| znorm | Inf | ||
| sky | -Inf | -Inf | -NaN |
| S/N | 23.4 | 42.4 | 42.5 |
| S/N(c) | 0.0 | 0.0 | 0.0 |
| SN(E/C) |
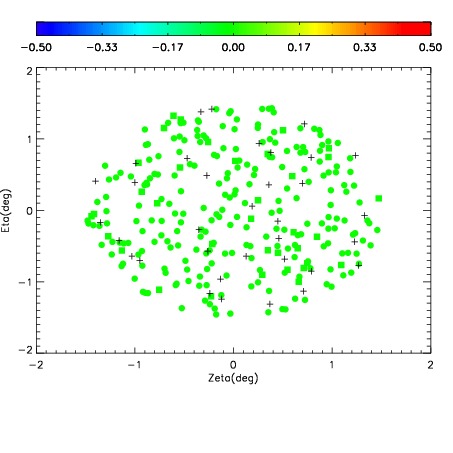
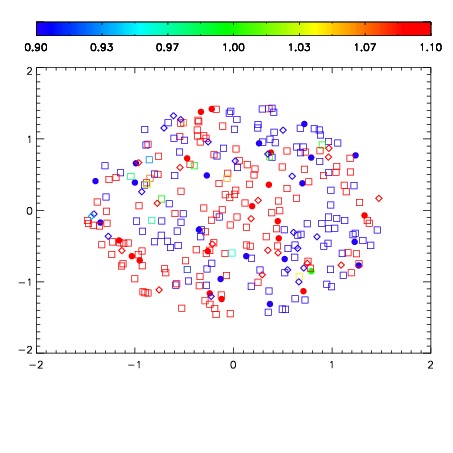
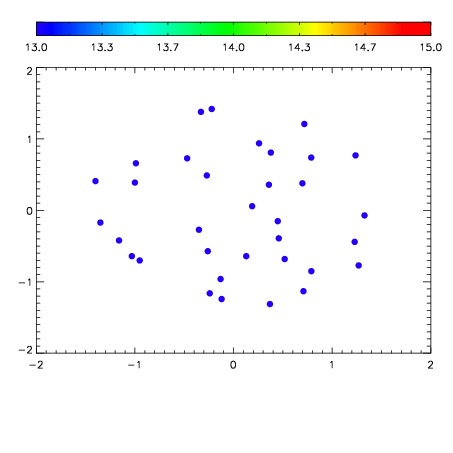

| Frame | Nreads | Zeropoints | Mag plots | Spatial mag deviation | Spatial sky 16325A emission deviations (filled: sky, open: star) | Spatial sky continuum emission | Spatial sky telluric CO2 absorption deviations (filled: H < 10) | |||||||||||||||||||||||
| 0 | 0 |
|
|
|
|
|
|
| IPAIR | NAME | SHIFT | NEWSHIFT | S/N | NAME | SHIFT | NEWSHIFT | S/N |
| 0 | 06760023 | 0.491354 | 0.00000 | 19.1545 | 06760021 | 0.00000 | 0.491354 | 19.1107 |
| 1 | 06760027 | 0.489654 | 0.00169998 | 19.1814 | 06760028 | 0.00225442 | 0.489100 | 19.1975 |
| 2 | 06760022 | 0.490910 | 0.000443995 | 19.1624 | 06760024 | 0.00421765 | 0.487136 | 19.1872 |
| 3 | 06760026 | 0.489118 | 0.00223598 | 19.1595 | 06760025 | 0.00116911 | 0.490185 | 19.1709 |