| Red | Green | Blue | |
| z | 17.64 | ||
| znorm | Inf | ||
| sky | -Inf | -Inf | -Inf |
| S/N | 33.5 | 58.6 | 61.9 |
| S/N(c) | 0.0 | 0.0 | 0.0 |
| SN(E/C) |
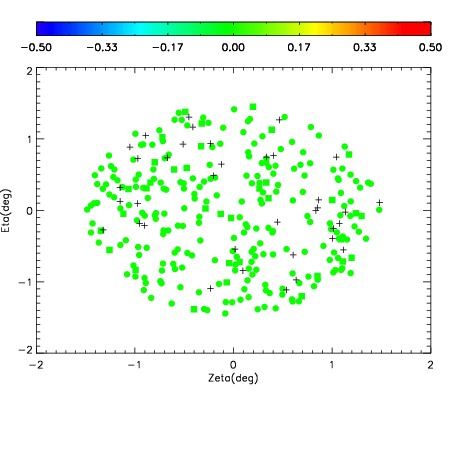
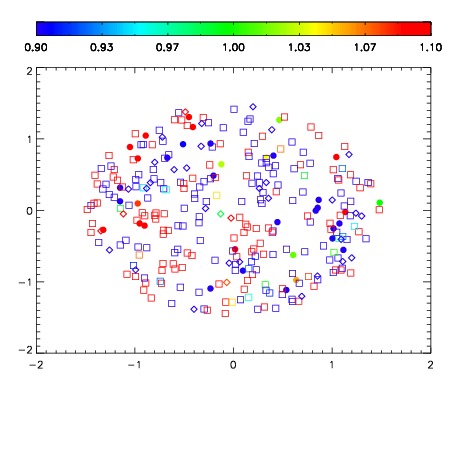
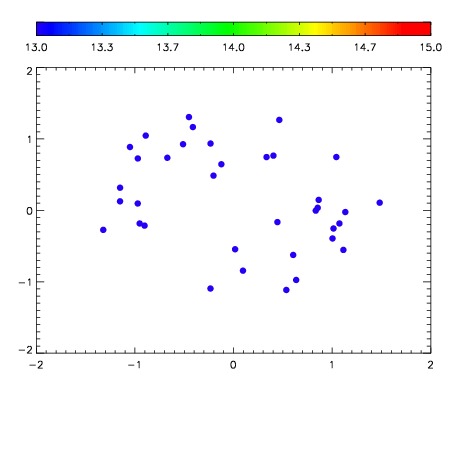

| Frame | Nreads | Zeropoints | Mag plots | Spatial mag deviation | Spatial sky 16325A emission deviations (filled: sky, open: star) | Spatial sky continuum emission | Spatial sky telluric CO2 absorption deviations (filled: H < 10) | |||||||||||||||||||||||
| 0 | 0 |
|
|
|
|
|
|
| IPAIR | NAME | SHIFT | NEWSHIFT | S/N | NAME | SHIFT | NEWSHIFT | S/N |
| 0 | 02850055 | 0.414593 | 0.00000 | 19.1030 | 02850056 | 0.00355616 | 0.411037 | 19.1310 |
| 1 | 02850051 | 0.411858 | 0.00273502 | 19.0384 | 02850053 | -0.00158193 | 0.416175 | 19.0215 |
| 2 | 02850050 | 0.410151 | 0.00444201 | 19.0253 | 02850052 | 0.00332716 | 0.411266 | 19.0092 |
| 3 | 02850054 | 0.412475 | 0.00211802 | 19.0046 | 02850049 | -0.00133395 | 0.415927 | 18.9559 |
| 4 | 02850047 | 0.411926 | 0.00266701 | 18.9625 | 02850048 | 0.00346152 | 0.411132 | 18.9218 |
| 5 | 02850046 | 0.410838 | 0.00375500 | 18.9508 | 02850045 | 0.00000 | 0.414593 | 18.8081 |