| Red | Green | Blue | |
| z | 17.64 | ||
| znorm | Inf | ||
| sky | -Inf | -NaN | -NaN |
| S/N | 17.9 | 33.0 | 33.8 |
| S/N(c) | 0.0 | 0.0 | 0.0 |
| SN(E/C) |
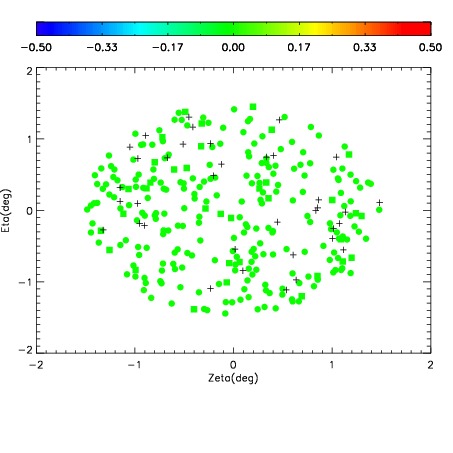
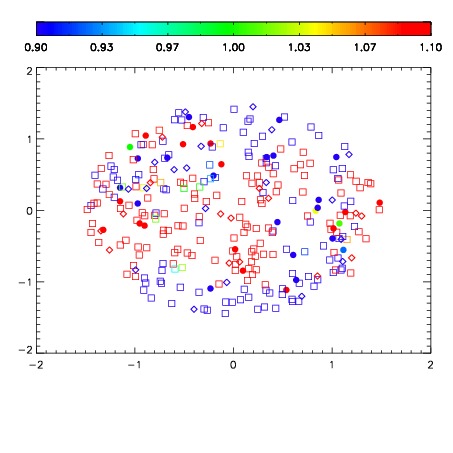
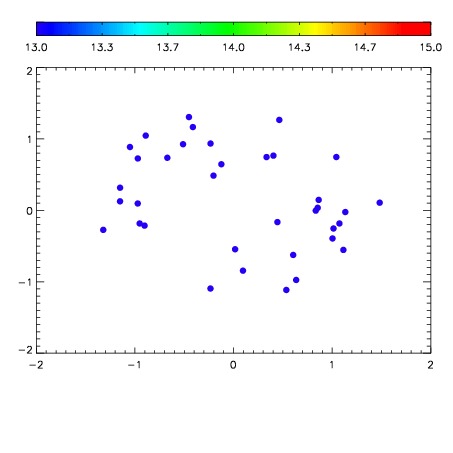

| Frame | Nreads | Zeropoints | Mag plots | Spatial mag deviation | Spatial sky 16325A emission deviations (filled: sky, open: star) | Spatial sky continuum emission | Spatial sky telluric CO2 absorption deviations (filled: H < 10) | |||||||||||||||||||||||
| 0 | 0 |
|
|
|
|
|
|
| IPAIR | NAME | SHIFT | NEWSHIFT | S/N | NAME | SHIFT | NEWSHIFT | S/N |
| 0 | 03220042 | 0.530861 | 0.00000 | 18.9071 | 03220051 | 0.00262087 | 0.528240 | 18.5720 |
| 1 | 03220050 | 0.519009 | 0.0118520 | 18.4937 | 03220048 | 0.00196251 | 0.528899 | 18.3689 |
| 2 | 03220041 | 0.524301 | 0.00656003 | 17.9895 | 03220043 | -0.000156360 | 0.531017 | 18.1298 |
| 3 | 03220046 | 0.525513 | 0.00534803 | 17.9863 | 03220047 | 0.00230423 | 0.528557 | 17.8815 |
| 4 | 03220049 | 0.517530 | 0.0133310 | 17.6683 | 03220040 | 0.00000 | 0.530861 | 16.9163 |
| 5 | 03220045 | 0.518929 | 0.0119320 | 17.6293 | 03220044 | 0.000415796 | 0.530445 | 16.0156 |