| Red | Green | Blue | |
| z | 17.64 | ||
| znorm | Inf | ||
| sky | -Inf | -Inf | -Inf |
| S/N | 23.0 | 42.4 | 44.3 |
| S/N(c) | 0.0 | 0.0 | 0.0 |
| SN(E/C) |
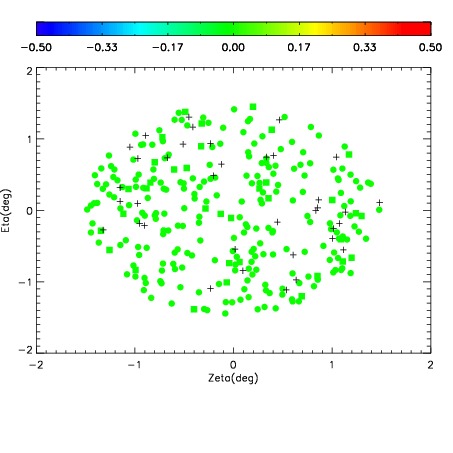


| Frame | Nreads | Zeropoints | Mag plots | Spatial mag deviation | Spatial sky 16325A emission deviations (filled: sky, open: star) | Spatial sky continuum emission | Spatial sky telluric CO2 absorption deviations (filled: H < 10) | |||||||||||||||||||||||
| 0 | 0 |
|
|
|
|
|
|
| IPAIR | NAME | SHIFT | NEWSHIFT | S/N | NAME | SHIFT | NEWSHIFT | S/N |
| 0 | 03430069 | 0.501862 | 0.00000 | 18.9163 | 03430067 | 0.00000 | 0.501862 | 18.8976 |
| 1 | 03430068 | 0.500574 | 0.00128800 | 18.8973 | 03430070 | 0.00138994 | 0.500472 | 18.8475 |
| 2 | 03430072 | 0.497865 | 0.00399700 | 18.6833 | 03430071 | -0.00272761 | 0.504590 | 18.7233 |
| 3 | 03430073 | 0.501528 | 0.000333965 | 18.3933 | 03430074 | 0.000735906 | 0.501126 | 18.6086 |