| Red | Green | Blue | |
| z | 17.63 | ||
| znorm | Inf | ||
| sky | -NaN | -NaN | -Inf |
| S/N | 28.3 | 48.7 | 50.7 |
| S/N(c) | 0.0 | 0.0 | 0.0 |
| SN(E/C) |
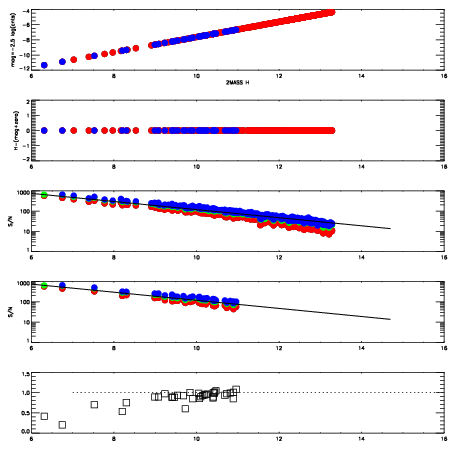
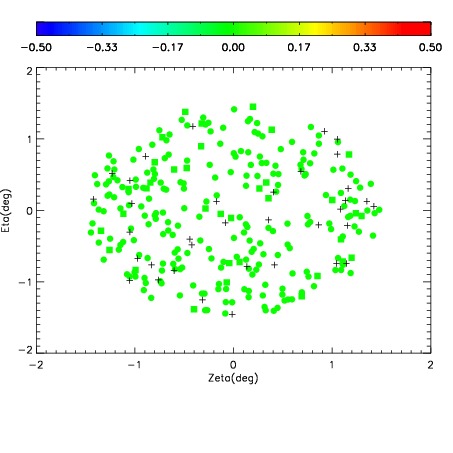
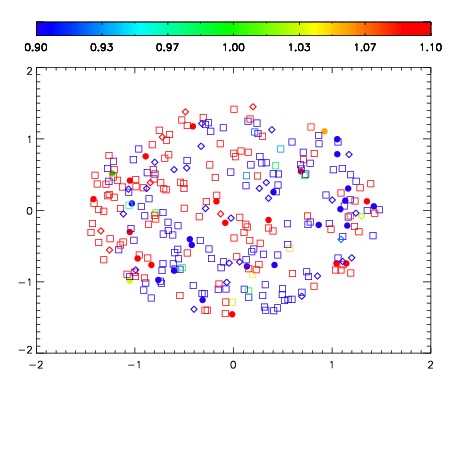
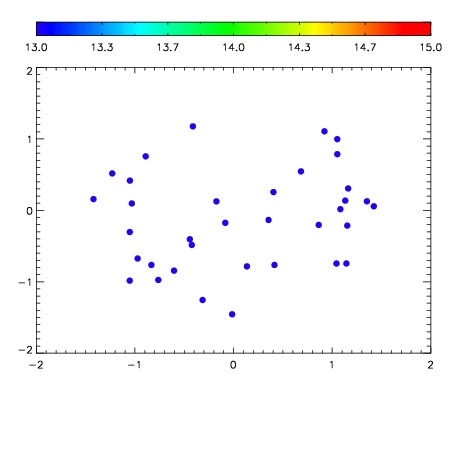

| Frame | Nreads | Zeropoints | Mag plots | Spatial mag deviation | Spatial sky 16325A emission deviations (filled: sky, open: star) | Spatial sky continuum emission | Spatial sky telluric CO2 absorption deviations (filled: H < 10) | |||||||||||||||||||||||
| 0 | 0 |
|
|
|
|
|
|
| IPAIR | NAME | SHIFT | NEWSHIFT | S/N | NAME | SHIFT | NEWSHIFT | S/N |
| 0 | 02820096 | 0.420946 | 0.00000 | 19.0644 | 02820094 | -0.000631333 | 0.421577 | 19.0300 |
| 1 | 02820091 | 0.412239 | 0.00870702 | 19.0648 | 02820097 | 0.00204333 | 0.418903 | 19.1035 |
| 2 | 02820095 | 0.413859 | 0.00708699 | 19.0514 | 02820093 | 0.000368997 | 0.420577 | 18.9735 |
| 3 | 02820092 | 0.415439 | 0.00550699 | 19.0257 | 02820090 | 0.00000 | 0.420946 | 18.9628 |