| Red | Green | Blue | |
| z | 17.64 | ||
| znorm | Inf | ||
| sky | -NaN | -NaN | -NaN |
| S/N | 29.5 | 50.4 | 53.5 |
| S/N(c) | 0.0 | 0.0 | 0.0 |
| SN(E/C) |
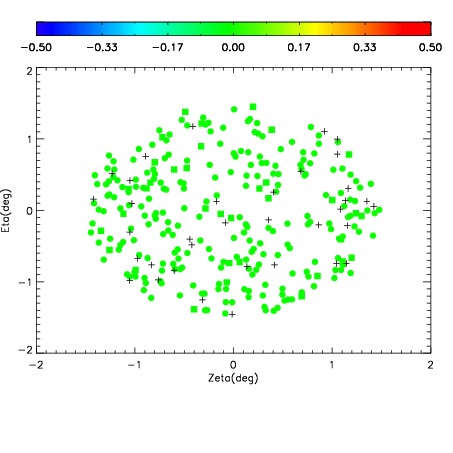
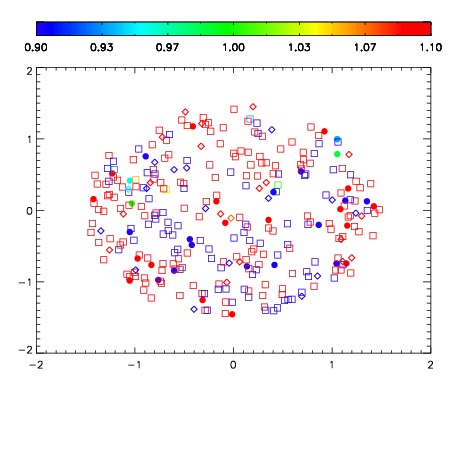
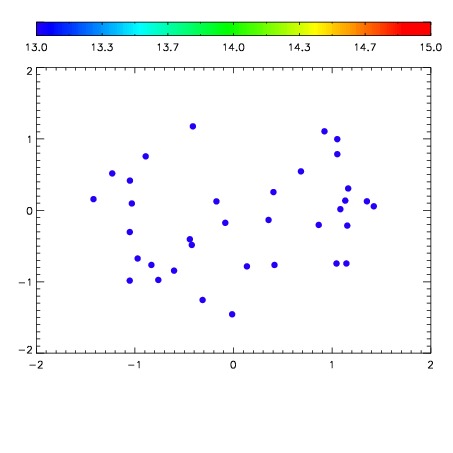

| Frame | Nreads | Zeropoints | Mag plots | Spatial mag deviation | Spatial sky 16325A emission deviations (filled: sky, open: star) | Spatial sky continuum emission | Spatial sky telluric CO2 absorption deviations (filled: H < 10) | |||||||||||||||||||||||
| 0 | 0 |
|
|
|
|
|
|
| IPAIR | NAME | SHIFT | NEWSHIFT | S/N | NAME | SHIFT | NEWSHIFT | S/N |
| 0 | 03440067 | 0.510302 | 0.00000 | 19.1299 | 03440068 | 0.00246416 | 0.507838 | 19.0541 |
| 1 | 03440063 | 0.507835 | 0.00246704 | 19.2171 | 03440065 | 0.00194410 | 0.508358 | 19.1667 |
| 2 | 03440062 | 0.504530 | 0.00577199 | 19.1671 | 03440064 | 0.00315659 | 0.507145 | 19.1601 |
| 3 | 03440066 | 0.509268 | 0.00103402 | 19.1470 | 03440061 | 0.00000 | 0.510302 | 19.1332 |