| Red | Green | Blue | |
| z | 17.63 | ||
| znorm | Inf | ||
| sky | -NaN | -NaN | -NaN |
| S/N | 25.5 | 44.7 | 47.7 |
| S/N(c) | 0.0 | 0.0 | 0.0 |
| SN(E/C) |
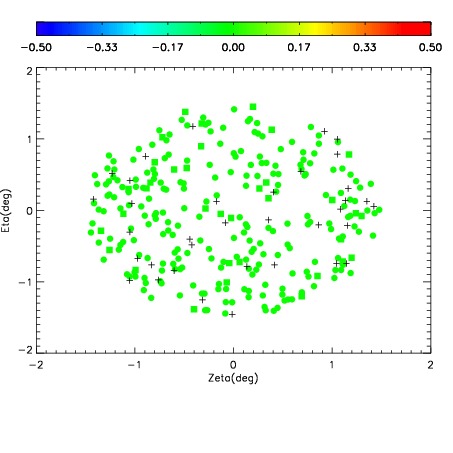
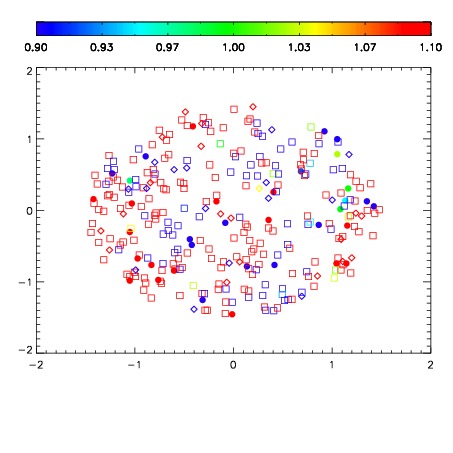
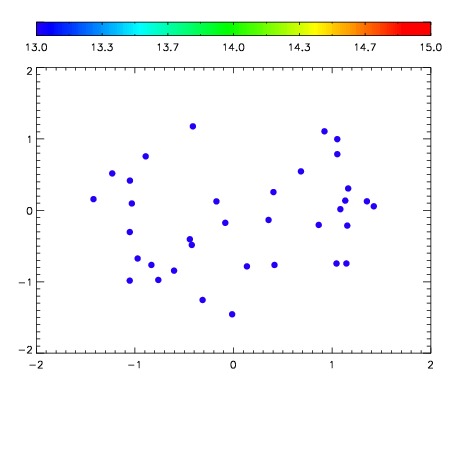

| Frame | Nreads | Zeropoints | Mag plots | Spatial mag deviation | Spatial sky 16325A emission deviations (filled: sky, open: star) | Spatial sky continuum emission | Spatial sky telluric CO2 absorption deviations (filled: H < 10) | |||||||||||||||||||||||
| 0 | 0 |
|
|
|
|
|
|
| IPAIR | NAME | SHIFT | NEWSHIFT | S/N | NAME | SHIFT | NEWSHIFT | S/N |
| 0 | 03690058 | 0.502636 | 0.00000 | 19.0182 | 03690056 | 0.00000 | 0.502636 | 18.9721 |
| 1 | 03690061 | 0.498024 | 0.00461203 | 18.8586 | 03690059 | -0.000297090 | 0.502933 | 18.9015 |
| 2 | 03690057 | 0.499611 | 0.00302503 | 18.8240 | 03690060 | 0.00381762 | 0.498818 | 18.8306 |
| 3 | 03690062 | 0.500177 | 0.00245899 | 18.8140 | 03690063 | 0.00369731 | 0.498939 | 18.8087 |