| Red | Green | Blue | |
| z | 17.63 | ||
| znorm | Inf | ||
| sky | -NaN | -NaN | -NaN |
| S/N | 28.3 | 49.8 | 53.5 |
| S/N(c) | 0.0 | 0.0 | 0.0 |
| SN(E/C) |
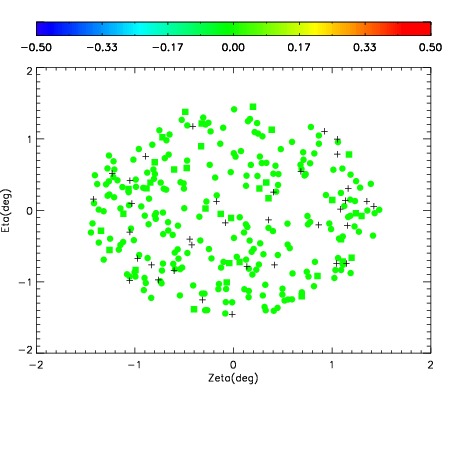

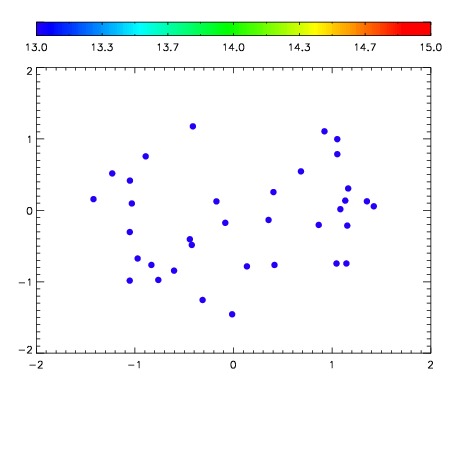

| Frame | Nreads | Zeropoints | Mag plots | Spatial mag deviation | Spatial sky 16325A emission deviations (filled: sky, open: star) | Spatial sky continuum emission | Spatial sky telluric CO2 absorption deviations (filled: H < 10) | |||||||||||||||||||||||
| 0 | 0 |
|
|
|
|
|
|
| IPAIR | NAME | SHIFT | NEWSHIFT | S/N | NAME | SHIFT | NEWSHIFT | S/N |
| 0 | 03700051 | 0.497855 | 0.00000 | 19.0042 | 03700056 | -0.000437136 | 0.498292 | 18.9660 |
| 1 | 03700055 | 0.497552 | 0.000303000 | 19.0685 | 03700052 | 0.00151403 | 0.496341 | 19.1143 |
| 2 | 03700054 | 0.495176 | 0.00267902 | 19.0299 | 03700053 | 0.000335336 | 0.497520 | 19.0023 |
| 3 | 03700050 | 0.496513 | 0.00134200 | 18.9591 | 03700049 | 0.00000 | 0.497855 | 18.8468 |