| Red | Green | Blue | |
| z | 17.64 | ||
| znorm | Inf | ||
| sky | -Inf | -Inf | -Inf |
| S/N | 29.1 | 50.4 | 52.4 |
| S/N(c) | 0.0 | 0.0 | 0.0 |
| SN(E/C) |
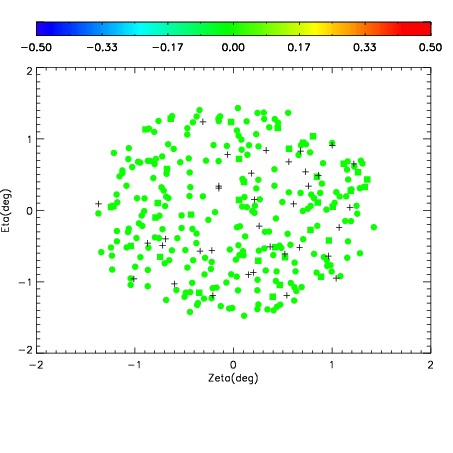
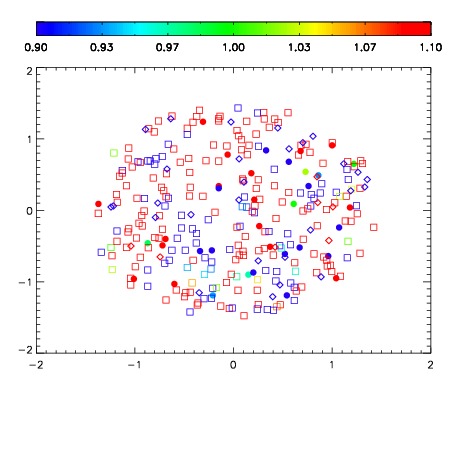
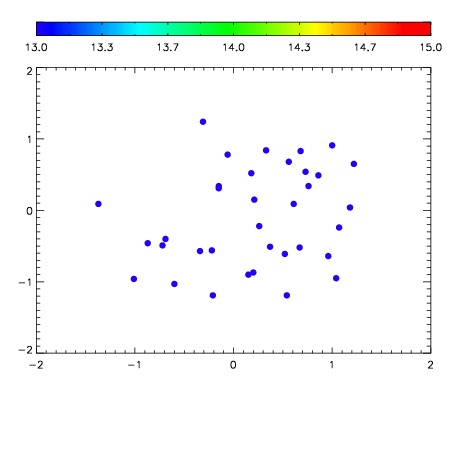

| Frame | Nreads | Zeropoints | Mag plots | Spatial mag deviation | Spatial sky 16325A emission deviations (filled: sky, open: star) | Spatial sky continuum emission | Spatial sky telluric CO2 absorption deviations (filled: H < 10) | |||||||||||||||||||||||
| 0 | 0 |
|
|
|
|
|
|
| IPAIR | NAME | SHIFT | NEWSHIFT | S/N | NAME | SHIFT | NEWSHIFT | S/N |
| 0 | 03720051 | 0.515236 | 0.00000 | 19.1490 | 03720052 | 0.00186875 | 0.513367 | 19.1539 |
| 1 | 03720055 | 0.512891 | 0.00234503 | 19.1733 | 03720056 | 0.00119695 | 0.514039 | 19.1748 |
| 2 | 03720054 | 0.511213 | 0.00402302 | 19.1681 | 03720053 | 0.000118703 | 0.515117 | 19.1721 |
| 3 | 03720050 | 0.510950 | 0.00428599 | 19.1476 | 03720049 | 0.00000 | 0.515236 | 19.1236 |