| Red | Green | Blue | |
| z | 17.63 | ||
| znorm | Inf | ||
| sky | -NaN | -NaN | -Inf |
| S/N | 14.8 | 26.5 | 26.8 |
| S/N(c) | 0.0 | 0.0 | 0.0 |
| SN(E/C) |
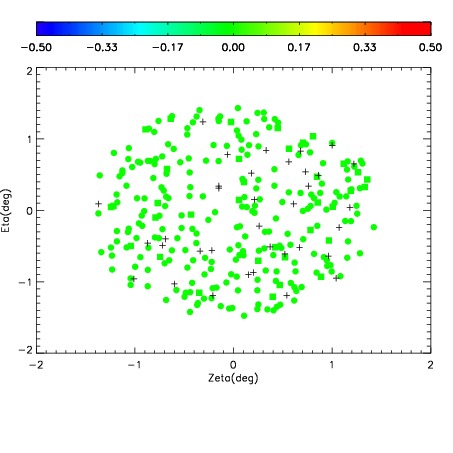
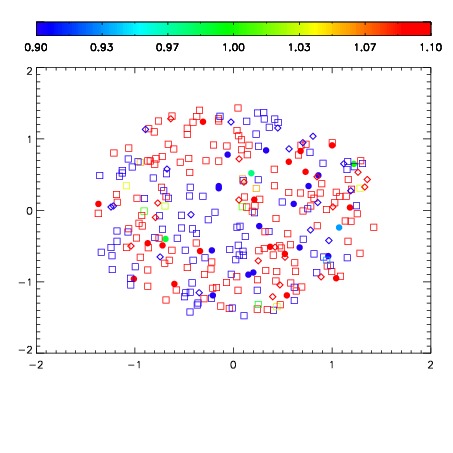
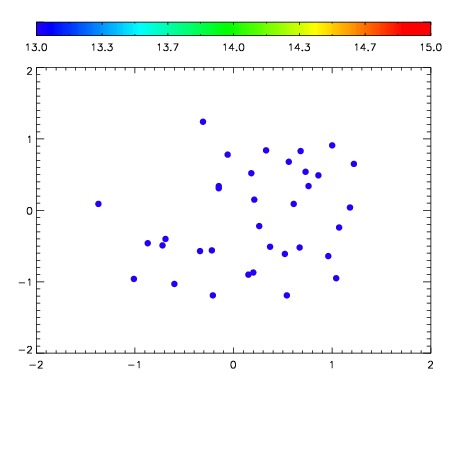

| Frame | Nreads | Zeropoints | Mag plots | Spatial mag deviation | Spatial sky 16325A emission deviations (filled: sky, open: star) | Spatial sky continuum emission | Spatial sky telluric CO2 absorption deviations (filled: H < 10) | |||||||||||||||||||||||
| 0 | 0 |
|
|
|
|
|
|
| IPAIR | NAME | SHIFT | NEWSHIFT | S/N | NAME | SHIFT | NEWSHIFT | S/N |
| 0 | 04270010 | 0.487340 | 0.00000 | 18.3311 | 04270008 | 0.00000 | 0.487340 | 18.2744 |
| 1 | 04270013 | 0.483533 | 0.00380701 | 18.2875 | 04270011 | -0.00385466 | 0.491195 | 18.0338 |
| 2 | 04270014 | 0.484467 | 0.00287300 | 18.2818 | 04270012 | -0.00446182 | 0.491802 | 18.0299 |
| 3 | 04270009 | 0.486168 | 0.00117201 | 18.1421 | 04270015 | -0.00499151 | 0.492332 | 17.7267 |