| Red | Green | Blue | |
| z | 17.64 | ||
| znorm | Inf | ||
| sky | -NaN | -Inf | -Inf |
| S/N | 31.9 | 55.2 | 57.0 |
| S/N(c) | 0.0 | 0.0 | 0.0 |
| SN(E/C) |
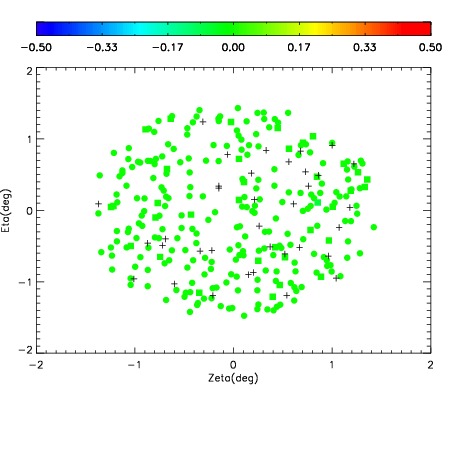
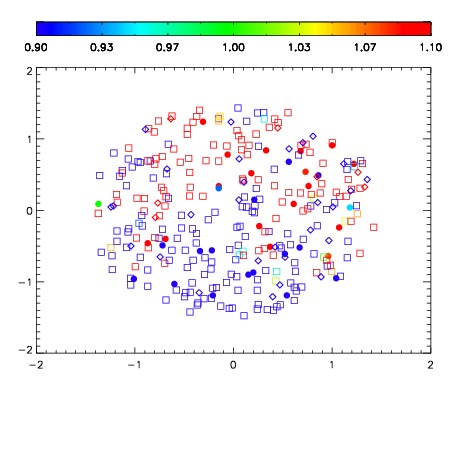
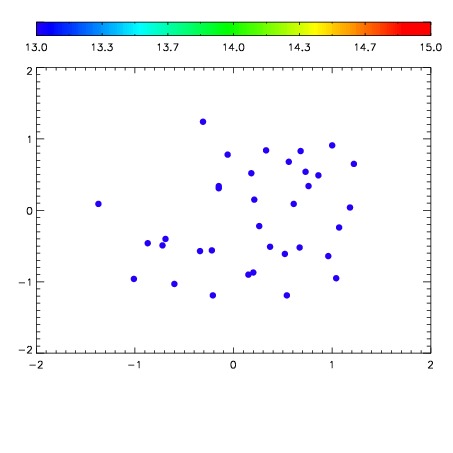

| Frame | Nreads | Zeropoints | Mag plots | Spatial mag deviation | Spatial sky 16325A emission deviations (filled: sky, open: star) | Spatial sky continuum emission | Spatial sky telluric CO2 absorption deviations (filled: H < 10) | |||||||||||||||||||||||
| 0 | 0 |
|
|
|
|
|
|
| IPAIR | NAME | SHIFT | NEWSHIFT | S/N | NAME | SHIFT | NEWSHIFT | S/N |
| 0 | 06690094 | 0.480867 | 0.00000 | 18.9481 | 06690095 | 0.00113879 | 0.479728 | 18.9932 |
| 1 | 06690090 | 0.477809 | 0.00305799 | 18.9655 | 06690087 | 0.000743240 | 0.480124 | 19.0042 |
| 2 | 06690089 | 0.477609 | 0.00325799 | 18.9399 | 06690088 | -0.000148894 | 0.481016 | 18.9602 |
| 3 | 06690086 | 0.479024 | 0.00184301 | 18.9340 | 06690091 | 0.00257190 | 0.478295 | 18.9301 |
| 4 | 06690085 | 0.477852 | 0.00301501 | 18.9117 | 06690092 | 0.000585360 | 0.480282 | 18.9007 |
| 5 | 06690093 | 0.479794 | 0.00107300 | 18.8643 | 06690084 | 0.00000 | 0.480867 | 18.8660 |