| Red | Green | Blue | |
| z | 17.64 | ||
| znorm | Inf | ||
| sky | -Inf | -Inf | -Inf |
| S/N | 20.0 | 35.3 | 36.9 |
| S/N(c) | 0.0 | 0.0 | 0.0 |
| SN(E/C) |
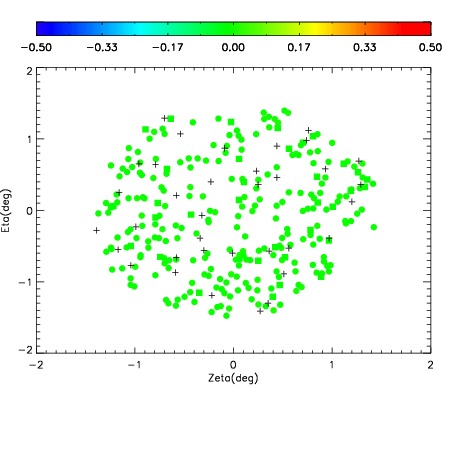
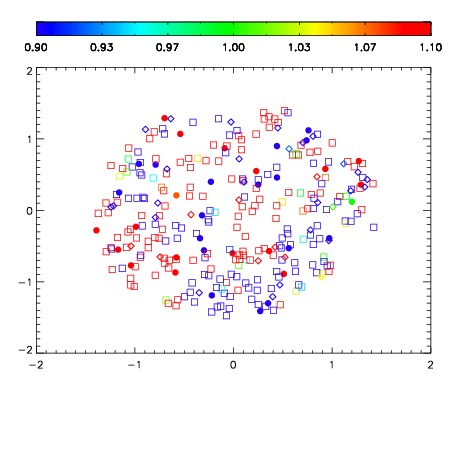
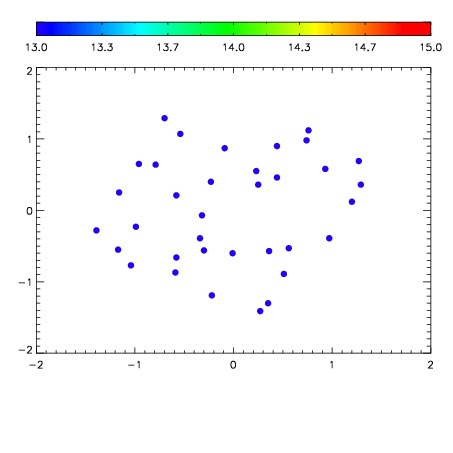

| Frame | Nreads | Zeropoints | Mag plots | Spatial mag deviation | Spatial sky 16325A emission deviations (filled: sky, open: star) | Spatial sky continuum emission | Spatial sky telluric CO2 absorption deviations (filled: H < 10) | |||||||||||||||||||||||
| 0 | 0 |
|
|
|
|
|
|
| IPAIR | NAME | SHIFT | NEWSHIFT | S/N | NAME | SHIFT | NEWSHIFT | S/N |
| 0 | 03740014 | 0.505088 | 0.00000 | 18.4481 | 03740008 | 0.00000 | 0.505088 | 18.5228 |
| 1 | 03740013 | 0.500629 | 0.00445896 | 18.5849 | 03740012 | -0.000125019 | 0.505213 | 18.6654 |
| 2 | 03740009 | 0.503289 | 0.00179899 | 18.4948 | 03740011 | 0.000844989 | 0.504243 | 18.6082 |
| 3 | 03740010 | 0.503005 | 0.00208294 | 18.4808 | 03740015 | 0.00241030 | 0.502678 | 18.6024 |