| Red | Green | Blue | |
| z | 17.64 | ||
| znorm | Inf | ||
| sky | -Inf | -NaN | -Inf |
| S/N | 24.5 | 41.0 | 44.0 |
| S/N(c) | 0.0 | 0.0 | 0.0 |
| SN(E/C) |
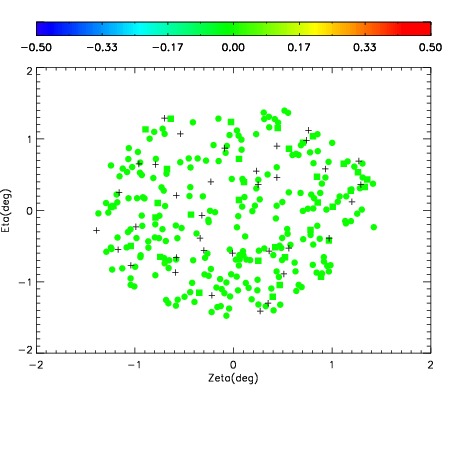
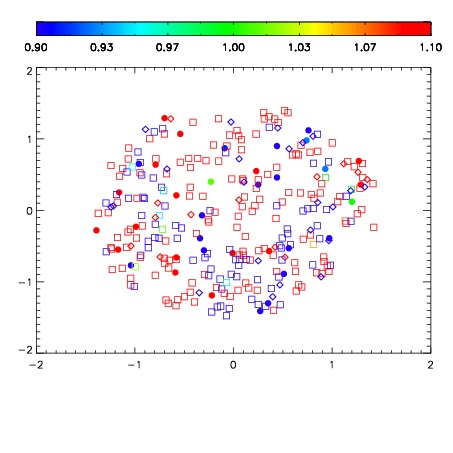
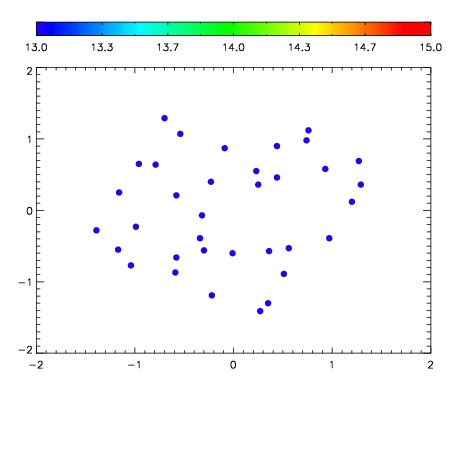

| Frame | Nreads | Zeropoints | Mag plots | Spatial mag deviation | Spatial sky 16325A emission deviations (filled: sky, open: star) | Spatial sky continuum emission | Spatial sky telluric CO2 absorption deviations (filled: H < 10) | |||||||||||||||||||||||
| 0 | 0 |
|
|
|
|
|
|
| IPAIR | NAME | SHIFT | NEWSHIFT | S/N | NAME | SHIFT | NEWSHIFT | S/N |
| 0 | 04280016 | 0.491233 | 0.00000 | 18.8046 | 04280014 | -0.00265125 | 0.493884 | 18.8434 |
| 1 | 04280012 | 0.489779 | 0.00145400 | 18.9033 | 04280022 | -0.00265728 | 0.493890 | 18.9343 |
| 2 | 04280015 | 0.490611 | 0.000622004 | 18.8182 | 04280013 | 0.00358605 | 0.487647 | 18.8725 |
| 3 | 04280011 | 0.489612 | 0.00162098 | 18.8005 | 04280010 | 0.00000 | 0.491233 | 18.6784 |