| Red | Green | Blue | |
| z | 17.64 | ||
| znorm | Inf | ||
| sky | -NaN | -Inf | -Inf |
| S/N | 24.0 | 40.5 | 44.2 |
| S/N(c) | 0.0 | 0.0 | 0.0 |
| SN(E/C) |
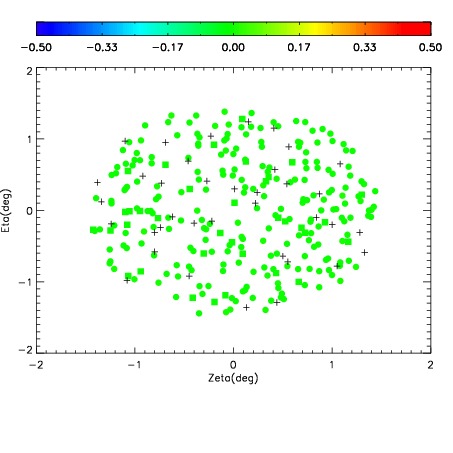
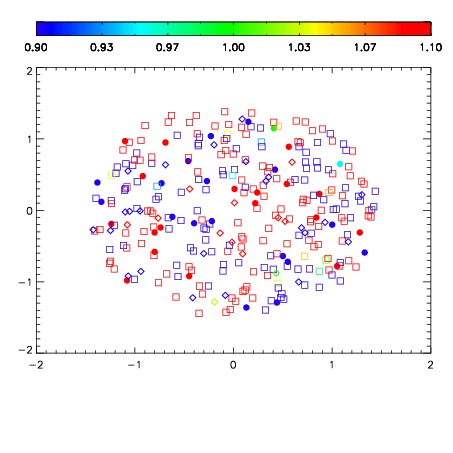


| Frame | Nreads | Zeropoints | Mag plots | Spatial mag deviation | Spatial sky 16325A emission deviations (filled: sky, open: star) | Spatial sky continuum emission | Spatial sky telluric CO2 absorption deviations (filled: H < 10) | |||||||||||||||||||||||
| 0 | 0 |
|
|
|
|
|
|
| IPAIR | NAME | SHIFT | NEWSHIFT | S/N | NAME | SHIFT | NEWSHIFT | S/N |
| 0 | 02920036 | 0.402356 | 0.00000 | 18.9682 | 02920041 | 0.00138950 | 0.400966 | 19.0325 |
| 1 | 02920040 | 0.400707 | 0.00164899 | 18.9576 | 02920037 | -0.000517296 | 0.402873 | 18.9893 |
| 2 | 02920039 | 0.400112 | 0.00224400 | 18.9380 | 02920038 | -0.00253177 | 0.404888 | 18.9370 |
| 3 | 02920035 | 0.400342 | 0.00201401 | 18.8719 | 02920034 | 0.00000 | 0.402356 | 18.8339 |