| Red | Green | Blue | |
| z | 17.64 | ||
| znorm | Inf | ||
| sky | -Inf | -Inf | -NaN |
| S/N | 23.4 | 40.6 | 43.4 |
| S/N(c) | 0.0 | 0.0 | 0.0 |
| SN(E/C) |
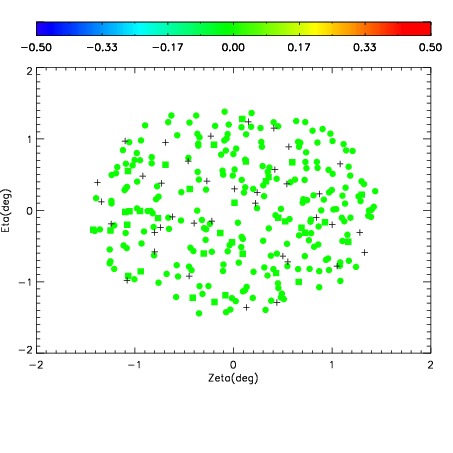
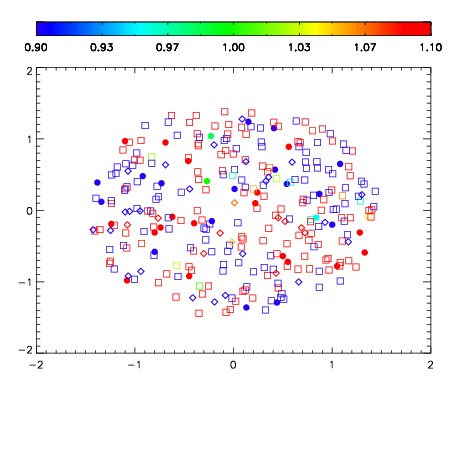
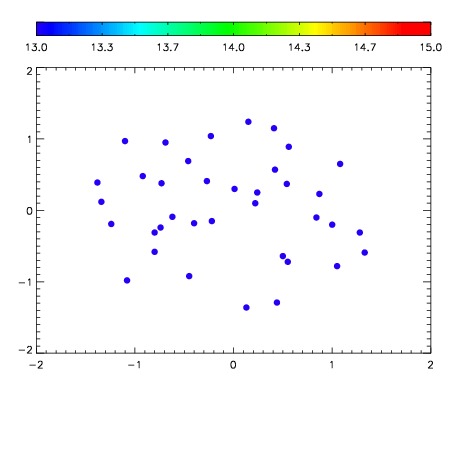

| Frame | Nreads | Zeropoints | Mag plots | Spatial mag deviation | Spatial sky 16325A emission deviations (filled: sky, open: star) | Spatial sky continuum emission | Spatial sky telluric CO2 absorption deviations (filled: H < 10) | |||||||||||||||||||||||
| 0 | 0 |
|
|
|
|
|
|
| IPAIR | NAME | SHIFT | NEWSHIFT | S/N | NAME | SHIFT | NEWSHIFT | S/N |
| 0 | 03180031 | 0.503117 | 0.00000 | 18.9444 | 03180032 | 0.00107283 | 0.502044 | 18.9377 |
| 1 | 03180030 | 0.496518 | 0.00659904 | 18.8791 | 03180029 | -0.000810500 | 0.503928 | 18.8897 |
| 2 | 03180027 | 0.498135 | 0.00498202 | 18.7454 | 03180028 | -1.87972e-05 | 0.503136 | 18.8455 |
| 3 | 03180026 | 0.496413 | 0.00670403 | 18.7429 | 03180025 | 0.00000 | 0.503117 | 18.8085 |