| Red | Green | Blue | |
| z | 17.64 | ||
| znorm | Inf | ||
| sky | -Inf | -Inf | -Inf |
| S/N | 31.6 | 53.2 | 56.7 |
| S/N(c) | 0.0 | 0.0 | 0.0 |
| SN(E/C) |
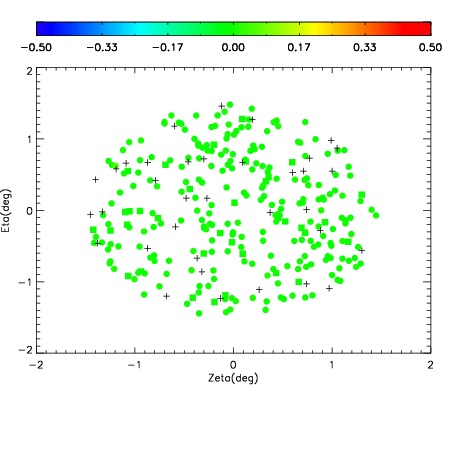
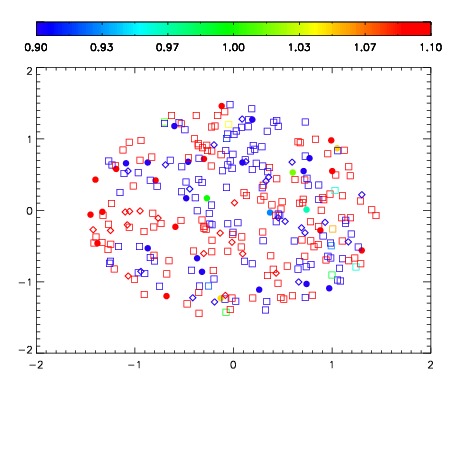


| Frame | Nreads | Zeropoints | Mag plots | Spatial mag deviation | Spatial sky 16325A emission deviations (filled: sky, open: star) | Spatial sky continuum emission | Spatial sky telluric CO2 absorption deviations (filled: H < 10) | |||||||||||||||||||||||
| 0 | 0 |
|
|
|
|
|
|
| IPAIR | NAME | SHIFT | NEWSHIFT | S/N | NAME | SHIFT | NEWSHIFT | S/N |
| 0 | 02910055 | 0.401251 | 0.00000 | 19.1305 | 02910057 | 0.00105714 | 0.400194 | 19.1467 |
| 1 | 02910051 | 0.400257 | 0.000993997 | 19.2211 | 02910053 | 6.63400e-05 | 0.401185 | 19.2527 |
| 2 | 02910050 | 0.399251 | 0.00199997 | 19.2142 | 02910052 | 0.00269655 | 0.398554 | 19.2501 |
| 3 | 02910058 | 0.398701 | 0.00254998 | 19.1935 | 02910049 | 0.00000 | 0.401251 | 19.1820 |
| 4 | 02910054 | 0.400375 | 0.000875980 | 19.1873 | 02910056 | 0.00194667 | 0.399304 | 19.1544 |