| Red | Green | Blue | |
| z | 17.64 | ||
| znorm | Inf | ||
| sky | -Inf | -Inf | -Inf |
| S/N | 30.0 | 51.6 | 55.5 |
| S/N(c) | 0.0 | 0.0 | 0.0 |
| SN(E/C) |
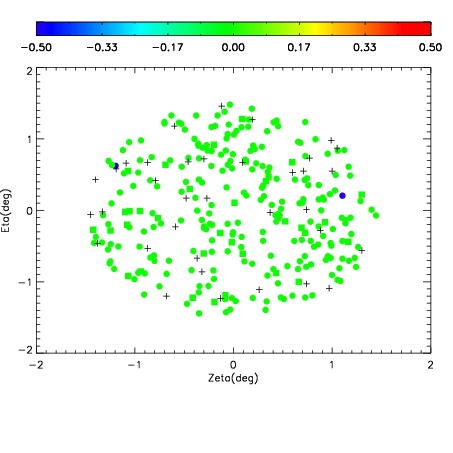
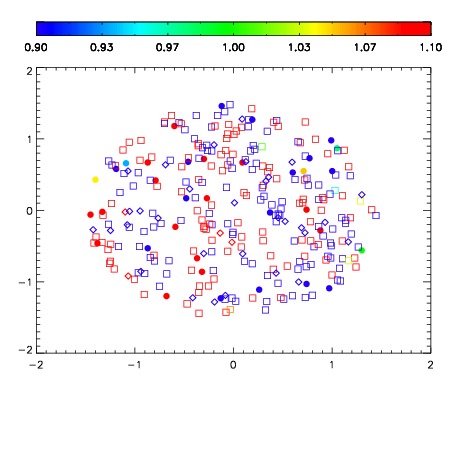
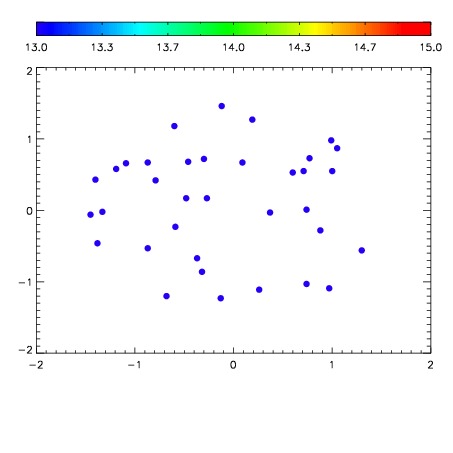

| Frame | Nreads | Zeropoints | Mag plots | Spatial mag deviation | Spatial sky 16325A emission deviations (filled: sky, open: star) | Spatial sky continuum emission | Spatial sky telluric CO2 absorption deviations (filled: H < 10) | |||||||||||||||||||||||
| 0 | 0 |
|
|
|
|
|
|
| IPAIR | NAME | SHIFT | NEWSHIFT | S/N | NAME | SHIFT | NEWSHIFT | S/N |
| 0 | 03670050 | 0.501388 | 0.00000 | 19.1389 | 03670051 | 0.000752203 | 0.500636 | 19.1830 |
| 1 | 03670049 | 0.496850 | 0.00453800 | 19.1960 | 03670048 | 0.00000 | 0.501388 | 19.1882 |
| 2 | 03670054 | 0.500085 | 0.00130302 | 19.1595 | 03670052 | 0.000209303 | 0.501179 | 19.1834 |
| 3 | 03670053 | 0.496468 | 0.00492001 | 19.1347 | 03670055 | 0.000857097 | 0.500531 | 19.1455 |