| Red | Green | Blue | |
| z | 17.64 | ||
| znorm | Inf | ||
| sky | -NaN | -NaN | -Inf |
| S/N | 27.8 | 48.5 | 52.3 |
| S/N(c) | 0.0 | 0.0 | 0.0 |
| SN(E/C) |
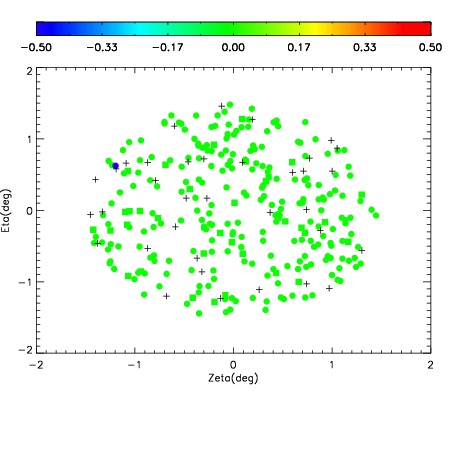
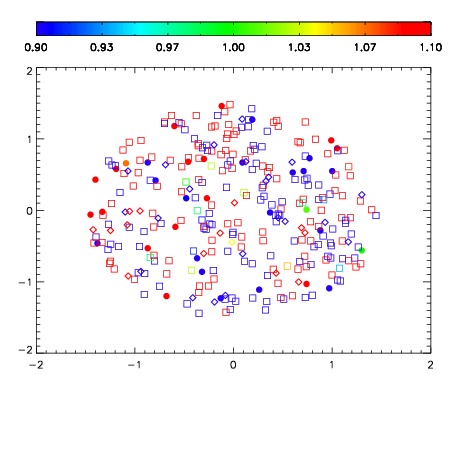
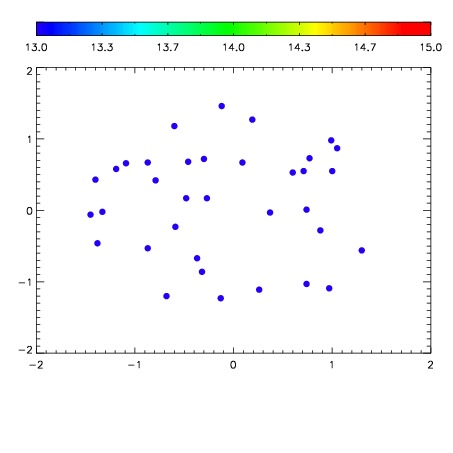

| Frame | Nreads | Zeropoints | Mag plots | Spatial mag deviation | Spatial sky 16325A emission deviations (filled: sky, open: star) | Spatial sky continuum emission | Spatial sky telluric CO2 absorption deviations (filled: H < 10) | |||||||||||||||||||||||
| 0 | 0 |
|
|
|
|
|
|
| IPAIR | NAME | SHIFT | NEWSHIFT | S/N | NAME | SHIFT | NEWSHIFT | S/N |
| 0 | 03710057 | 0.505293 | 0.00000 | 19.1958 | 03710055 | 0.000106569 | 0.505186 | 19.1951 |
| 1 | 03710056 | 0.498609 | 0.00668401 | 19.2017 | 03710058 | 0.00293019 | 0.502363 | 19.2175 |
| 2 | 03710053 | 0.504447 | 0.000846028 | 19.0917 | 03710054 | 0.00219022 | 0.503103 | 19.1515 |
| 3 | 03710052 | 0.501988 | 0.00330502 | 19.0374 | 03710051 | 0.00000 | 0.505293 | 19.0224 |