| Red | Green | Blue | |
| z | 17.63 | ||
| znorm | Inf | ||
| sky | -NaN | -NaN | -NaN |
| S/N | 22.5 | 35.2 | 35.1 |
| S/N(c) | 0.0 | 0.0 | 0.0 |
| SN(E/C) |
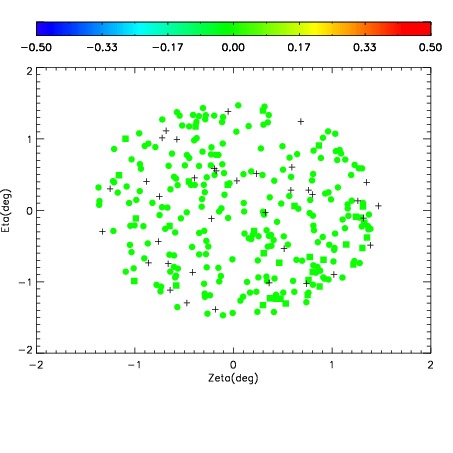
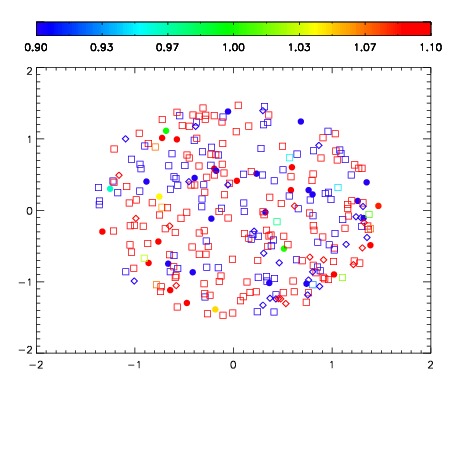
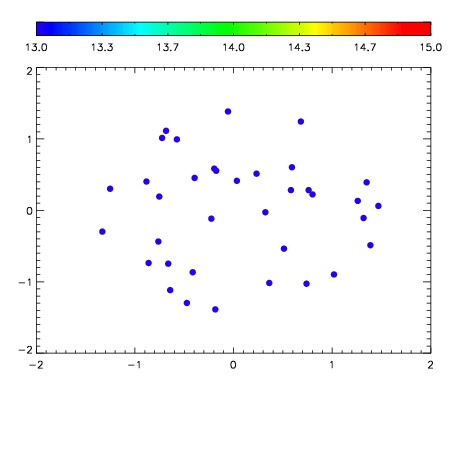

| Frame | Nreads | Zeropoints | Mag plots | Spatial mag deviation | Spatial sky 16325A emission deviations (filled: sky, open: star) | Spatial sky continuum emission | Spatial sky telluric CO2 absorption deviations (filled: H < 10) | |||||||||||||||||||||||
| 0 | 0 |
|
|
|
|
|
|
| IPAIR | NAME | SHIFT | NEWSHIFT | S/N | NAME | SHIFT | NEWSHIFT | S/N |
| 0 | 05490039 | 0.488498 | 0.00000 | 18.7669 | 05490040 | 0.00369819 | 0.484800 | 18.8370 |
| 1 | 05490038 | 0.485807 | 0.00269100 | 18.6604 | 05490037 | -0.000617984 | 0.489116 | 18.7046 |
| 2 | 05490034 | 0.484323 | 0.00417501 | 18.6324 | 05490036 | 0.00121490 | 0.487283 | 18.6383 |
| 3 | 05490035 | 0.485928 | 0.00257000 | 18.6019 | 05490033 | 0.00000 | 0.488498 | 18.3608 |