| Red | Green | Blue | |
| z | 17.63 | ||
| znorm | Inf | ||
| sky | -NaN | -NaN | -Inf |
| S/N | 26.9 | 41.3 | 43.6 |
| S/N(c) | 0.0 | 0.0 | 0.0 |
| SN(E/C) |

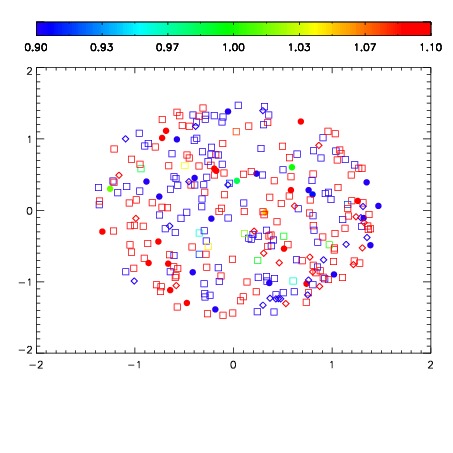


| Frame | Nreads | Zeropoints | Mag plots | Spatial mag deviation | Spatial sky 16325A emission deviations (filled: sky, open: star) | Spatial sky continuum emission | Spatial sky telluric CO2 absorption deviations (filled: H < 10) | |||||||||||||||||||||||
| 0 | 0 |
|
|
|
|
|
|
| IPAIR | NAME | SHIFT | NEWSHIFT | S/N | NAME | SHIFT | NEWSHIFT | S/N |
| 0 | 09790028 | 0.515347 | 0.00000 | 18.7809 | 09790029 | 0.00294530 | 0.512402 | 18.7617 |
| 1 | 09790032 | 0.513369 | 0.00197798 | 18.9650 | 09790033 | 0.00167238 | 0.513675 | 19.0044 |
| 2 | 09790031 | 0.513759 | 0.00158799 | 18.9509 | 09790030 | 0.00248454 | 0.512862 | 18.9064 |
| 3 | 09790027 | 0.515170 | 0.000177026 | 18.7944 | 09790026 | 0.00000 | 0.515347 | 18.7866 |