| Red | Green | Blue | |
| z | 17.63 | ||
| znorm | Inf | ||
| sky | -NaN | -NaN | -Inf |
| S/N | 18.4 | 31.8 | 31.7 |
| S/N(c) | 0.0 | 0.0 | 0.0 |
| SN(E/C) |
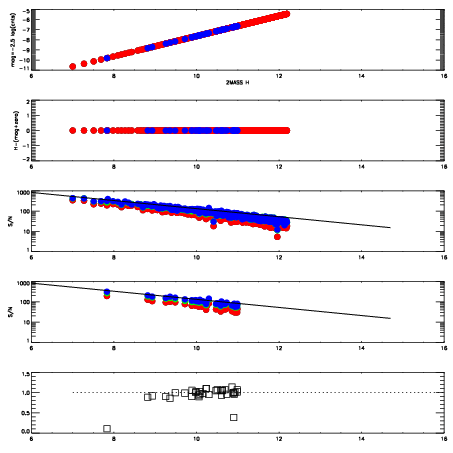
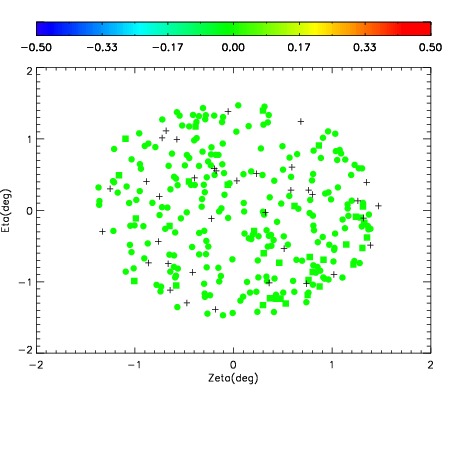

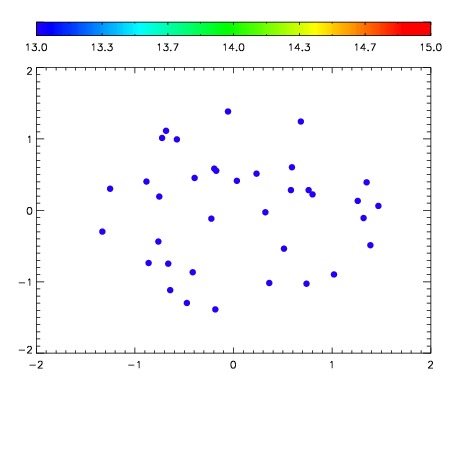

| Frame | Nreads | Zeropoints | Mag plots | Spatial mag deviation | Spatial sky 16325A emission deviations (filled: sky, open: star) | Spatial sky continuum emission | Spatial sky telluric CO2 absorption deviations (filled: H < 10) | |||||||||||||||||||||||
| 0 | 0 |
|
|
|
|
|
|
| IPAIR | NAME | SHIFT | NEWSHIFT | S/N | NAME | SHIFT | NEWSHIFT | S/N |
| 0 | 11960054 | 0.505134 | 0.00000 | 18.0424 | 11960052 | 0.00000 | 0.505134 | 17.8711 |
| 1 | 11960061 | 0.504086 | 0.00104797 | 18.5492 | 11960060 | 0.00121122 | 0.503923 | 18.6125 |
| 2 | 11960057 | 0.504850 | 0.000284016 | 18.5307 | 11960059 | 0.000384939 | 0.504749 | 18.4219 |
| 3 | 11960058 | 0.504937 | 0.000196993 | 18.1834 | 11960056 | 0.00217464 | 0.502959 | 18.2845 |
| 4 | 11960053 | 0.504100 | 0.00103396 | 17.9905 | 11960055 | 0.00134484 | 0.503789 | 17.7984 |