| Red | Green | Blue | |
| z | 17.64 | ||
| znorm | Inf | ||
| sky | -Inf | -Inf | -NaN |
| S/N | 22.6 | 37.6 | 34.0 |
| S/N(c) | 0.0 | 0.0 | 0.0 |
| SN(E/C) |
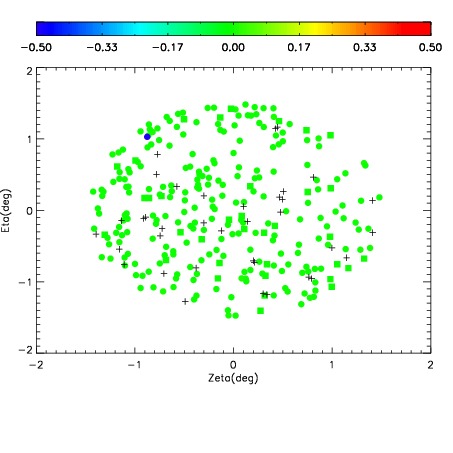
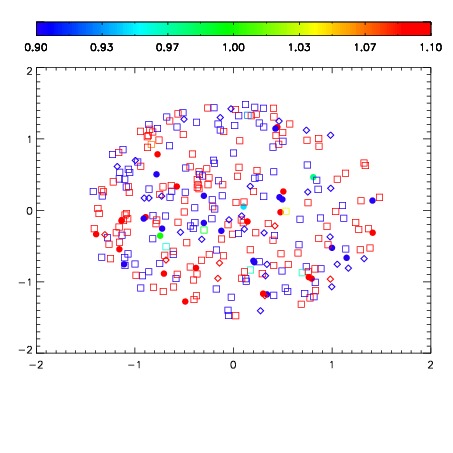
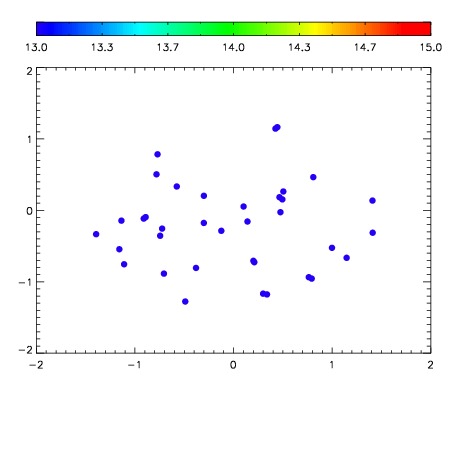

| Frame | Nreads | Zeropoints | Mag plots | Spatial mag deviation | Spatial sky 16325A emission deviations (filled: sky, open: star) | Spatial sky continuum emission | Spatial sky telluric CO2 absorption deviations (filled: H < 10) | |||||||||||||||||||||||
| 0 | 0 |
|
|
|
|
|
|
| IPAIR | NAME | SHIFT | NEWSHIFT | S/N | NAME | SHIFT | NEWSHIFT | S/N |
| 0 | 09100028 | 0.484217 | 0.00000 | 18.6095 | 09100022 | 0.00000 | 0.484217 | 18.5965 |
| 1 | 09100027 | 0.482059 | 0.00215799 | 18.8611 | 09100026 | 0.00435948 | 0.479858 | 18.8343 |
| 2 | 09100024 | 0.476254 | 0.00796300 | 18.7973 | 09100029 | 0.00216506 | 0.482052 | 18.8051 |
| 3 | 09100023 | 0.475596 | 0.00862098 | 18.7729 | 09100025 | 0.00423818 | 0.479979 | 18.7883 |