| Red | Green | Blue | |
| z | 17.64 | ||
| znorm | Inf | ||
| sky | -NaN | -NaN | -NaN |
| S/N | 24.5 | 37.3 | 37.9 |
| S/N(c) | 0.0 | 0.0 | 0.0 |
| SN(E/C) |
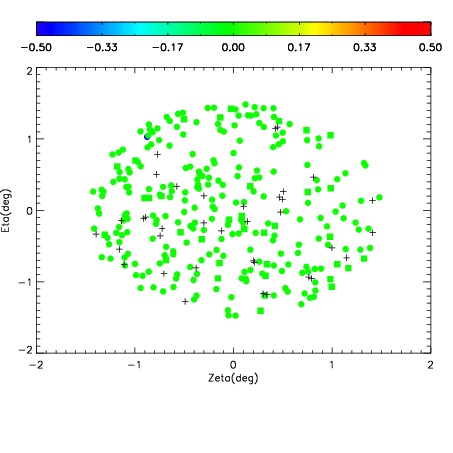
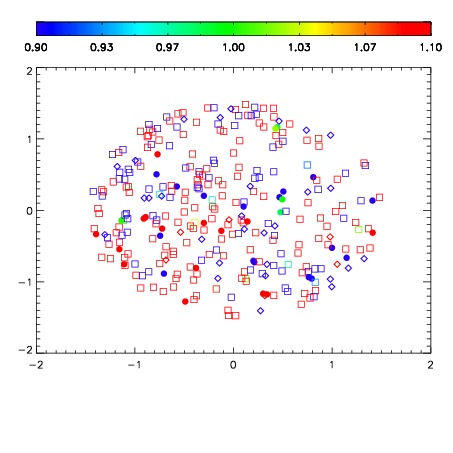
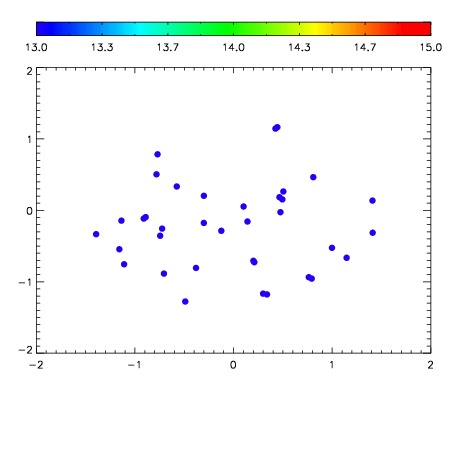

| Frame | Nreads | Zeropoints | Mag plots | Spatial mag deviation | Spatial sky 16325A emission deviations (filled: sky, open: star) | Spatial sky continuum emission | Spatial sky telluric CO2 absorption deviations (filled: H < 10) | |||||||||||||||||||||||
| 0 | 0 |
|
|
|
|
|
|
| IPAIR | NAME | SHIFT | NEWSHIFT | S/N | NAME | SHIFT | NEWSHIFT | S/N |
| 0 | 09770028 | 0.513415 | 0.00000 | 19.0024 | 09770029 | 0.000358505 | 0.513056 | 19.0005 |
| 1 | 09770027 | 0.512324 | 0.00109100 | 19.0191 | 09770026 | 0.00000 | 0.513415 | 19.0427 |
| 2 | 09770031 | 0.512180 | 0.00123501 | 18.9171 | 09770033 | -0.000288277 | 0.513703 | 18.9149 |
| 3 | 09770032 | 0.512389 | 0.00102597 | 18.9130 | 09770030 | -0.000217875 | 0.513633 | 18.8245 |