| Red | Green | Blue | |
| z | 17.64 | ||
| znorm | Inf | ||
| sky | -Inf | -Inf | -NaN |
| S/N | 16.4 | 27.5 | 27.0 |
| S/N(c) | 0.0 | 0.0 | 0.0 |
| SN(E/C) |
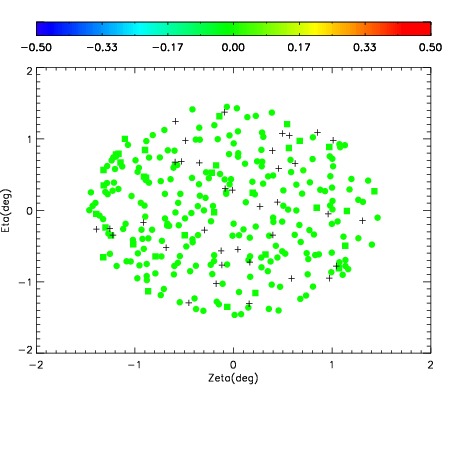
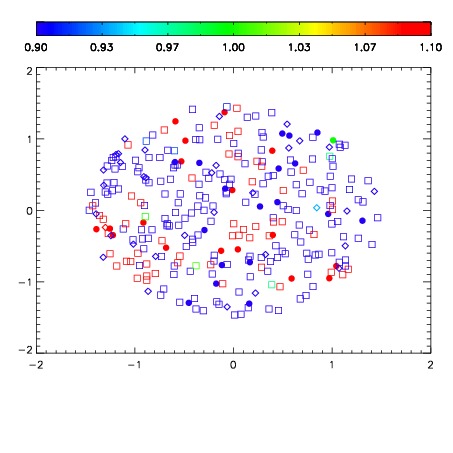
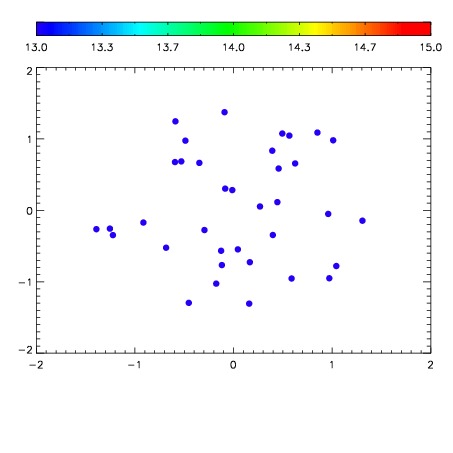

| Frame | Nreads | Zeropoints | Mag plots | Spatial mag deviation | Spatial sky 16325A emission deviations (filled: sky, open: star) | Spatial sky continuum emission | Spatial sky telluric CO2 absorption deviations (filled: H < 10) | |||||||||||||||||||||||
| 0 | 0 |
|
|
|
|
|
|
| IPAIR | NAME | SHIFT | NEWSHIFT | S/N | NAME | SHIFT | NEWSHIFT | S/N |
| 0 | 09100038 | 0.483534 | 0.00000 | 16.7225 | 09100037 | 0.00338227 | 0.480152 | 15.0727 |
| 1 | 09100035 | 0.477637 | 0.00589702 | 18.8576 | 09100033 | 0.00000 | 0.483534 | 18.7201 |
| 2 | 09100034 | 0.480095 | 0.00343901 | 18.2483 | 09100040 | 0.00525642 | 0.478278 | 18.6624 |
| 3 | 09100039 | 0.481125 | 0.00240901 | 18.2321 | 09100036 | 0.00365114 | 0.479883 | 18.0420 |