| Red | Green | Blue | |
| z | 17.64 | ||
| znorm | Inf | ||
| sky | -Inf | -Inf | -Inf |
| S/N | 30.1 | 49.5 | 54.6 |
| S/N(c) | 0.0 | 0.0 | 0.0 |
| SN(E/C) |
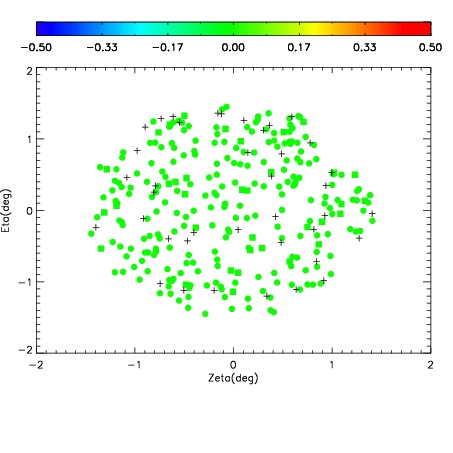
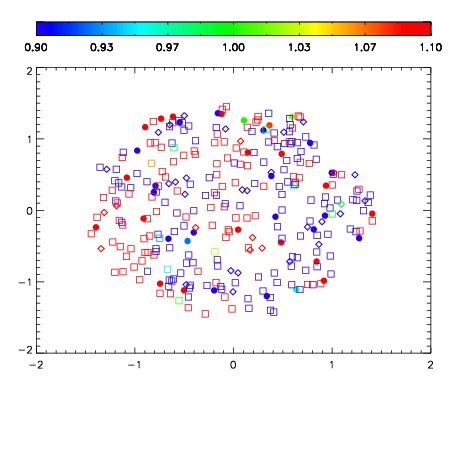
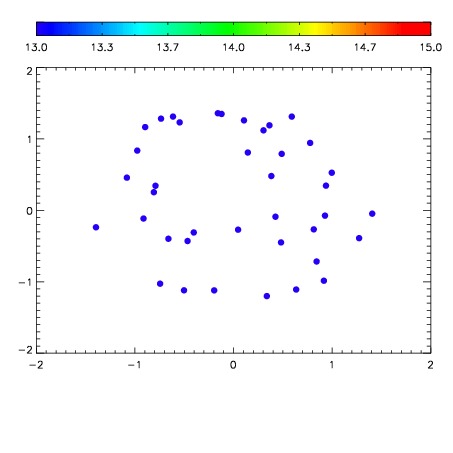

| Frame | Nreads | Zeropoints | Mag plots | Spatial mag deviation | Spatial sky 16325A emission deviations (filled: sky, open: star) | Spatial sky continuum emission | Spatial sky telluric CO2 absorption deviations (filled: H < 10) | |||||||||||||||||||||||
| 0 | 0 |
|
|
|
|
|
|
| IPAIR | NAME | SHIFT | NEWSHIFT | S/N | NAME | SHIFT | NEWSHIFT | S/N |
| 0 | 10210017 | 0.493657 | 0.00000 | 19.1680 | 10210014 | 0.00268821 | 0.490969 | 19.1653 |
| 1 | 10210012 | 0.493163 | 0.000494003 | 19.1751 | 10210015 | 0.00338840 | 0.490269 | 19.1765 |
| 2 | 10210013 | 0.492739 | 0.000918001 | 19.1721 | 10210011 | 0.00000 | 0.493657 | 19.1682 |
| 3 | 10210016 | 0.493175 | 0.000481993 | 19.1058 | 10210018 | 0.00336807 | 0.490289 | 19.1331 |