| Red | Green | Blue | |
| z | 17.64 | ||
| znorm | Inf | ||
| sky | -NaN | -NaN | -Inf |
| S/N | 23.9 | 40.3 | 45.1 |
| S/N(c) | 0.0 | 0.0 | 0.0 |
| SN(E/C) |
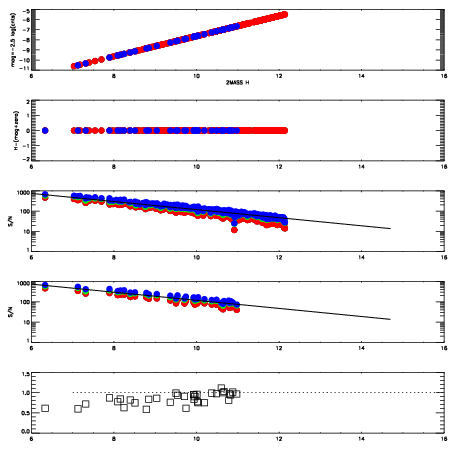
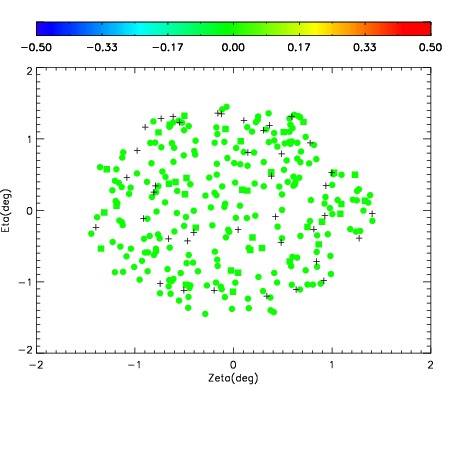
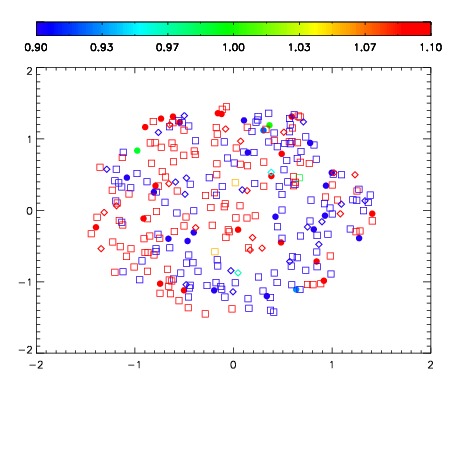


| Frame | Nreads | Zeropoints | Mag plots | Spatial mag deviation | Spatial sky 16325A emission deviations (filled: sky, open: star) | Spatial sky continuum emission | Spatial sky telluric CO2 absorption deviations (filled: H < 10) | |||||||||||||||||||||||
| 0 | 0 |
|
|
|
|
|
|
| IPAIR | NAME | SHIFT | NEWSHIFT | S/N | NAME | SHIFT | NEWSHIFT | S/N |
| 0 | 10250017 | 0.500747 | 0.00000 | 18.6013 | 10250018 | -0.00237832 | 0.503125 | 18.8021 |
| 1 | 10250012 | 0.497902 | 0.00284502 | 19.0227 | 10250011 | 0.00000 | 0.500747 | 19.0233 |
| 2 | 10250013 | 0.498649 | 0.00209802 | 18.7656 | 10250015 | -0.00424078 | 0.504988 | 18.8791 |
| 3 | 10250016 | 0.499759 | 0.000988036 | 18.7161 | 10250014 | -0.00429660 | 0.505044 | 18.8124 |