| Red | Green | Blue | |
| z | 17.64 | ||
| znorm | Inf | ||
| sky | -Inf | -Inf | -Inf |
| S/N | 25.9 | 45.2 | 49.6 |
| S/N(c) | 0.0 | 0.0 | 0.0 |
| SN(E/C) |
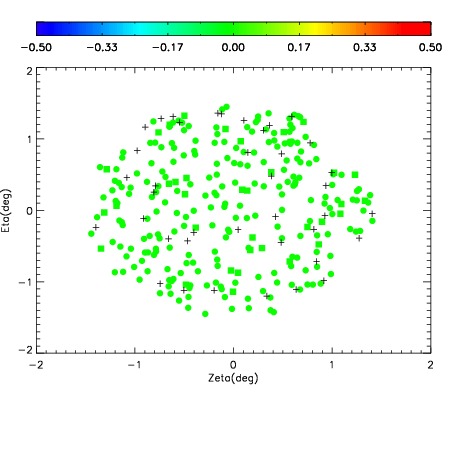
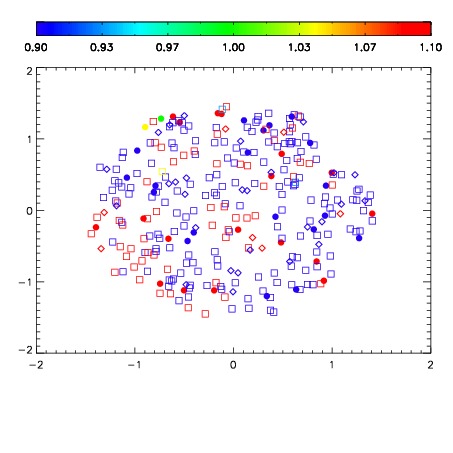
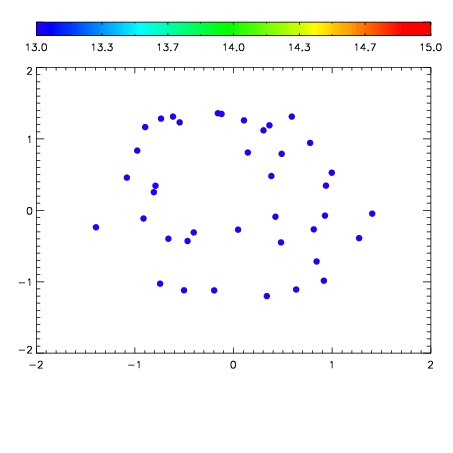

| Frame | Nreads | Zeropoints | Mag plots | Spatial mag deviation | Spatial sky 16325A emission deviations (filled: sky, open: star) | Spatial sky continuum emission | Spatial sky telluric CO2 absorption deviations (filled: H < 10) | |||||||||||||||||||||||
| 0 | 0 |
|
|
|
|
|
|
| IPAIR | NAME | SHIFT | NEWSHIFT | S/N | NAME | SHIFT | NEWSHIFT | S/N |
| 0 | 10490029 | 0.498977 | 0.00000 | 18.8208 | 10490035 | -0.000854363 | 0.499831 | 19.0092 |
| 1 | 10490033 | 0.498728 | 0.000248998 | 19.0231 | 10490028 | 0.00000 | 0.498977 | 19.0252 |
| 2 | 10490030 | 0.498952 | 2.50041e-05 | 19.0132 | 10490032 | -0.000999446 | 0.499976 | 19.0192 |
| 3 | 10490034 | 0.498761 | 0.000216007 | 18.9831 | 10490031 | -0.000717229 | 0.499694 | 19.0144 |