| Red | Green | Blue | |
| z | 17.64 | ||
| znorm | Inf | ||
| sky | -Inf | -Inf | -Inf |
| S/N | 26.2 | 42.9 | 45.1 |
| S/N(c) | 0.0 | 0.0 | 0.0 |
| SN(E/C) |
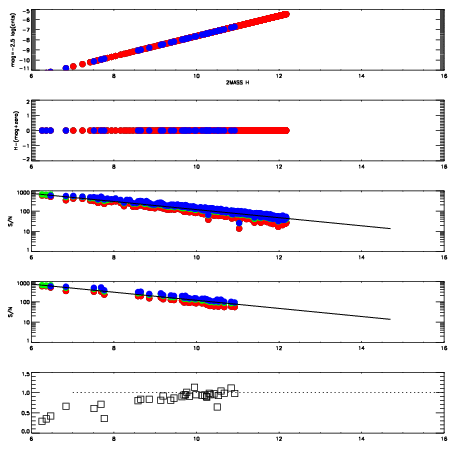

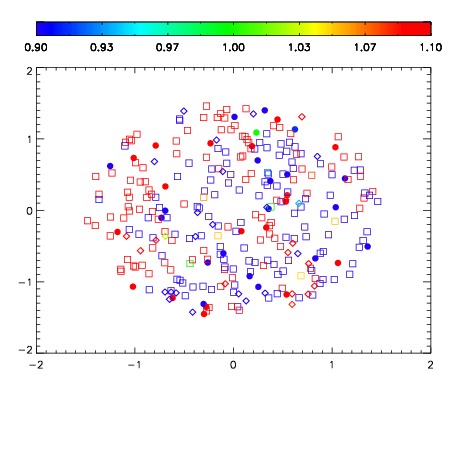
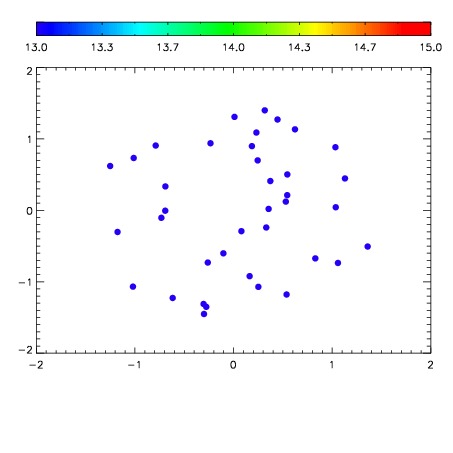

| Frame | Nreads | Zeropoints | Mag plots | Spatial mag deviation | Spatial sky 16325A emission deviations (filled: sky, open: star) | Spatial sky continuum emission | Spatial sky telluric CO2 absorption deviations (filled: H < 10) | |||||||||||||||||||||||
| 0 | 0 |
|
|
|
|
|
|
| IPAIR | NAME | SHIFT | NEWSHIFT | S/N | NAME | SHIFT | NEWSHIFT | S/N |
| 0 | 03340016 | 0.509523 | 0.00000 | 19.0494 | 03340017 | -0.00276954 | 0.512293 | 19.0936 |
| 1 | 03340012 | 0.508466 | 0.00105697 | 19.0361 | 03340013 | -0.00359925 | 0.513122 | 19.0759 |
| 2 | 03340011 | 0.504875 | 0.00464797 | 19.0336 | 03340010 | 0.00000 | 0.509523 | 19.0115 |
| 3 | 03340015 | 0.504312 | 0.00521100 | 19.0273 | 03340014 | -0.00489714 | 0.514420 | 18.9239 |