| Red | Green | Blue | |
| z | 17.64 | ||
| znorm | Inf | ||
| sky | -Inf | -NaN | -Inf |
| S/N | 26.9 | 44.5 | 46.4 |
| S/N(c) | 0.0 | 0.0 | 0.0 |
| SN(E/C) |
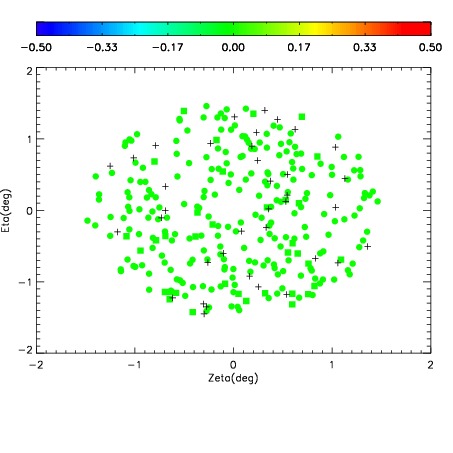
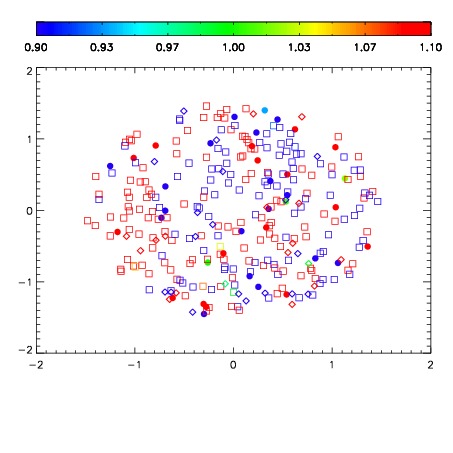
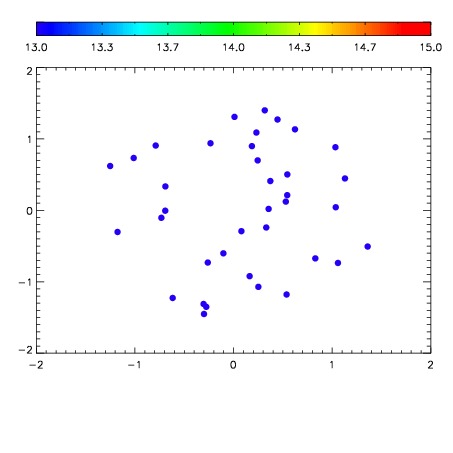

| Frame | Nreads | Zeropoints | Mag plots | Spatial mag deviation | Spatial sky 16325A emission deviations (filled: sky, open: star) | Spatial sky continuum emission | Spatial sky telluric CO2 absorption deviations (filled: H < 10) | |||||||||||||||||||||||
| 0 | 0 |
|
|
|
|
|
|
| IPAIR | NAME | SHIFT | NEWSHIFT | S/N | NAME | SHIFT | NEWSHIFT | S/N |
| 0 | 03410014 | 0.506011 | 0.00000 | 19.1291 | 03410015 | 0.00290642 | 0.503105 | 19.1507 |
| 1 | 03410010 | 0.505674 | 0.000337005 | 19.1152 | 03410011 | 0.00191716 | 0.504094 | 19.1334 |
| 2 | 03410013 | 0.499685 | 0.00632602 | 19.0901 | 03410012 | 0.00211876 | 0.503892 | 19.1007 |
| 3 | 03410009 | 0.499570 | 0.00644100 | 19.0461 | 03410008 | 0.00000 | 0.506011 | 17.8143 |