| Red | Green | Blue | |
| z | 17.64 | ||
| znorm | Inf | ||
| sky | -Inf | -Inf | -Inf |
| S/N | 22.2 | 38.4 | 40.5 |
| S/N(c) | 0.0 | 0.0 | 0.0 |
| SN(E/C) |
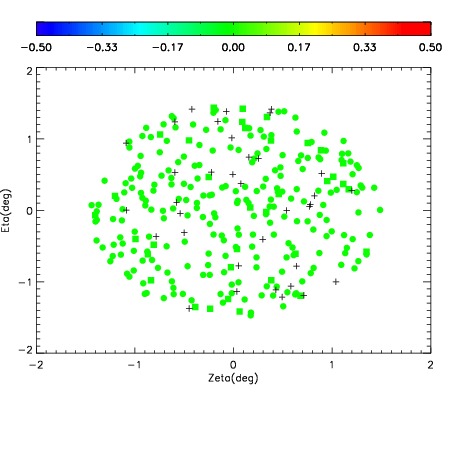
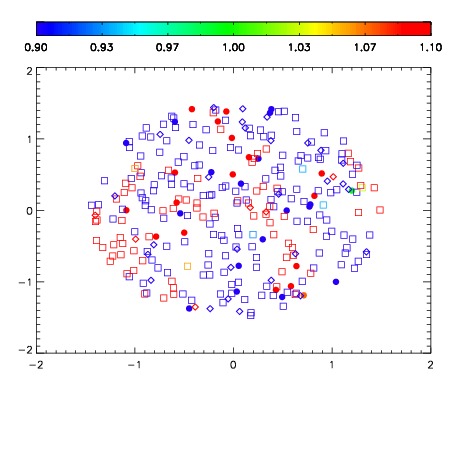
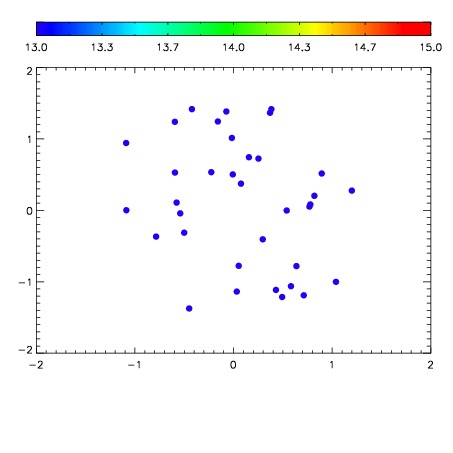

| Frame | Nreads | Zeropoints | Mag plots | Spatial mag deviation | Spatial sky 16325A emission deviations (filled: sky, open: star) | Spatial sky continuum emission | Spatial sky telluric CO2 absorption deviations (filled: H < 10) | |||||||||||||||||||||||
| 0 | 0 |
|
|
|
|
|
|
| IPAIR | NAME | SHIFT | NEWSHIFT | S/N | NAME | SHIFT | NEWSHIFT | S/N |
| 0 | 02820063 | 0.413493 | 0.00000 | 18.8074 | 02820064 | 0.000923688 | 0.412569 | 18.8793 |
| 1 | 02820062 | 0.411025 | 0.00246802 | 18.9359 | 02820061 | -0.00160429 | 0.415097 | 18.8930 |
| 2 | 02820059 | 0.412496 | 0.000997007 | 18.7148 | 02820060 | -0.000963341 | 0.414456 | 18.7985 |
| 3 | 02820058 | 0.410524 | 0.00296900 | 18.4437 | 02820057 | 0.00000 | 0.413493 | 18.3411 |