| Red | Green | Blue | |
| z | 17.64 | ||
| znorm | Inf | ||
| sky | -Inf | -Inf | -Inf |
| S/N | 25.8 | 42.2 | 43.7 |
| S/N(c) | 0.0 | 0.0 | 0.0 |
| SN(E/C) |
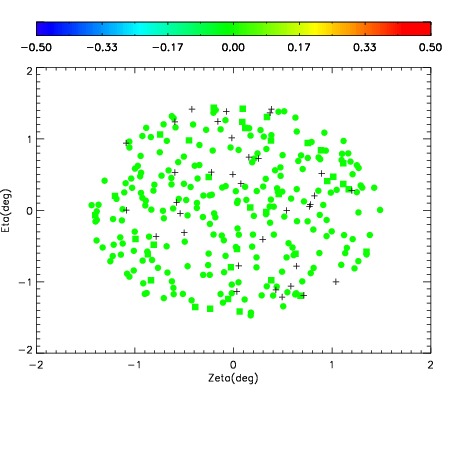
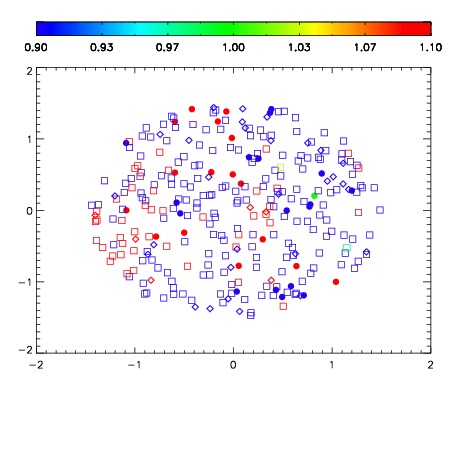


| Frame | Nreads | Zeropoints | Mag plots | Spatial mag deviation | Spatial sky 16325A emission deviations (filled: sky, open: star) | Spatial sky continuum emission | Spatial sky telluric CO2 absorption deviations (filled: H < 10) | |||||||||||||||||||||||
| 0 | 0 |
|
|
|
|
|
|
| IPAIR | NAME | SHIFT | NEWSHIFT | S/N | NAME | SHIFT | NEWSHIFT | S/N |
| 0 | 02880051 | 0.406787 | 0.00000 | 19.0740 | 02880053 | -0.00209283 | 0.408880 | 18.9960 |
| 1 | 02880054 | 0.402835 | 0.00395200 | 19.1048 | 02880049 | 0.00000 | 0.406787 | 19.0999 |
| 2 | 02880050 | 0.405961 | 0.000826001 | 19.0973 | 02880056 | -0.000966940 | 0.407754 | 19.0375 |
| 3 | 02880055 | 0.404326 | 0.00246102 | 19.0430 | 02880052 | 0.000362182 | 0.406425 | 18.9079 |