| Red | Green | Blue | |
| z | 17.64 | ||
| znorm | Inf | ||
| sky | -Inf | -Inf | -Inf |
| S/N | 23.4 | 40.5 | 42.8 |
| S/N(c) | 0.0 | 0.0 | 0.0 |
| SN(E/C) |
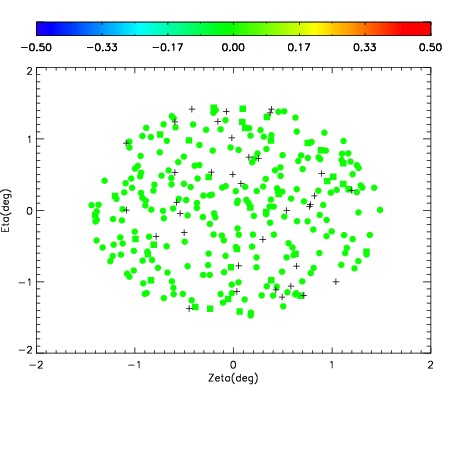


| Frame | Nreads | Zeropoints | Mag plots | Spatial mag deviation | Spatial sky 16325A emission deviations (filled: sky, open: star) | Spatial sky continuum emission | Spatial sky telluric CO2 absorption deviations (filled: H < 10) | |||||||||||||||||||||||
| 0 | 0 |
|
|
|
|
|
|
| IPAIR | NAME | SHIFT | NEWSHIFT | S/N | NAME | SHIFT | NEWSHIFT | S/N |
| 0 | 03090051 | 0.486096 | 0.00000 | 18.8916 | 03090045 | 0.00000 | 0.486096 | 18.8019 |
| 1 | 03090047 | 0.486082 | 1.40071e-05 | 18.9128 | 03090052 | 0.00277819 | 0.483318 | 18.8416 |
| 2 | 03090050 | 0.485536 | 0.000559986 | 18.8963 | 03090048 | 0.00216064 | 0.483935 | 18.8300 |
| 3 | 03090046 | 0.485464 | 0.000631988 | 18.8599 | 03090049 | 0.000167565 | 0.485928 | 18.7850 |