| Red | Green | Blue | |
| z | 17.64 | ||
| znorm | Inf | ||
| sky | -NaN | -NaN | -Inf |
| S/N | 27.4 | 47.8 | 53.1 |
| S/N(c) | 0.0 | 0.0 | 0.0 |
| SN(E/C) |

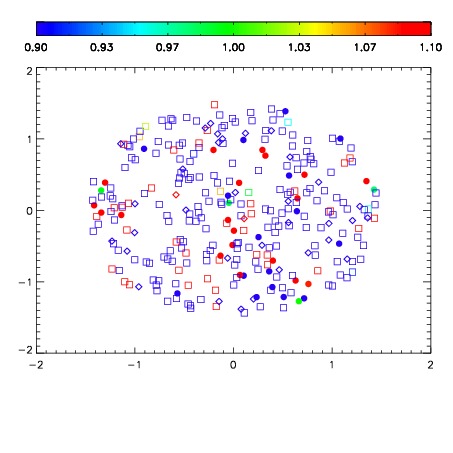
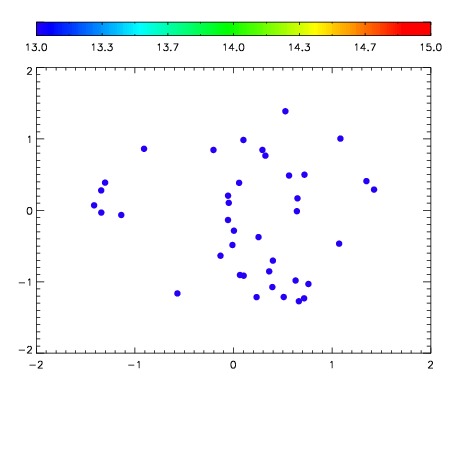

| Frame | Nreads | Zeropoints | Mag plots | Spatial mag deviation | Spatial sky 16325A emission deviations (filled: sky, open: star) | Spatial sky continuum emission | Spatial sky telluric CO2 absorption deviations (filled: H < 10) | |||||||||||||||||||||||
| 0 | 0 |
|
|
|
|
|
|
| IPAIR | NAME | SHIFT | NEWSHIFT | S/N | NAME | SHIFT | NEWSHIFT | S/N |
| 0 | 02890089 | 0.402937 | 0.00000 | 19.0221 | 02890087 | -0.00102500 | 0.403962 | 19.0462 |
| 1 | 02890092 | 0.401148 | 0.00178900 | 19.1215 | 02890091 | -0.000745119 | 0.403682 | 19.1396 |
| 2 | 02890088 | 0.400309 | 0.00262800 | 19.0595 | 02890090 | 0.00185546 | 0.401082 | 19.0962 |
| 3 | 02890085 | 0.402604 | 0.000332981 | 18.9610 | 02890086 | 0.00205076 | 0.400886 | 19.0339 |
| 4 | 02890084 | 0.400797 | 0.00213999 | 18.9310 | 02890083 | 0.00000 | 0.402937 | 19.0024 |