| Red | Green | Blue | |
| z | 17.64 | ||
| znorm | Inf | ||
| sky | -Inf | -Inf | -Inf |
| S/N | 25.9 | 45.3 | 47.0 |
| S/N(c) | 0.0 | 0.0 | 0.0 |
| SN(E/C) |


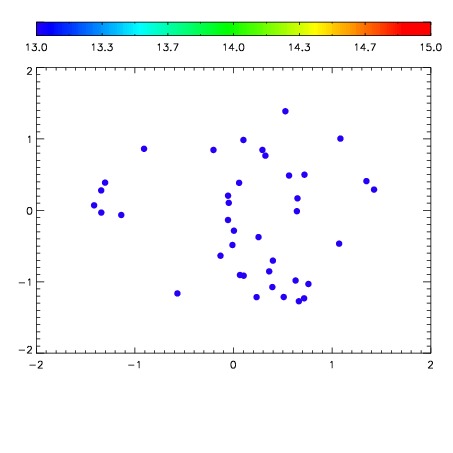

| Frame | Nreads | Zeropoints | Mag plots | Spatial mag deviation | Spatial sky 16325A emission deviations (filled: sky, open: star) | Spatial sky continuum emission | Spatial sky telluric CO2 absorption deviations (filled: H < 10) | |||||||||||||||||||||||
| 0 | 0 |
|
|
|
|
|
|
| IPAIR | NAME | SHIFT | NEWSHIFT | S/N | NAME | SHIFT | NEWSHIFT | S/N |
| 0 | 02910040 | 0.397255 | 0.00000 | 19.1836 | 02910038 | 0.00000 | 0.397255 | 19.1673 |
| 1 | 02910044 | 0.393438 | 0.00381699 | 19.2263 | 02910045 | 0.000455553 | 0.396799 | 19.2466 |
| 2 | 02910043 | 0.393294 | 0.00396100 | 19.1830 | 02910042 | -0.000608707 | 0.397864 | 19.0548 |
| 3 | 02910039 | 0.396814 | 0.000441015 | 19.1773 | 02910041 | 0.000937878 | 0.396317 | 18.8633 |