| Red | Green | Blue | |
| z | 17.64 | ||
| znorm | Inf | ||
| sky | -Inf | -Inf | -Inf |
| S/N | 19.7 | 36.4 | 39.0 |
| S/N(c) | 0.0 | 0.0 | 0.0 |
| SN(E/C) |
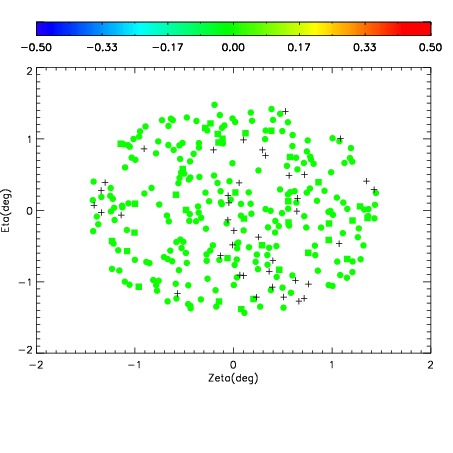
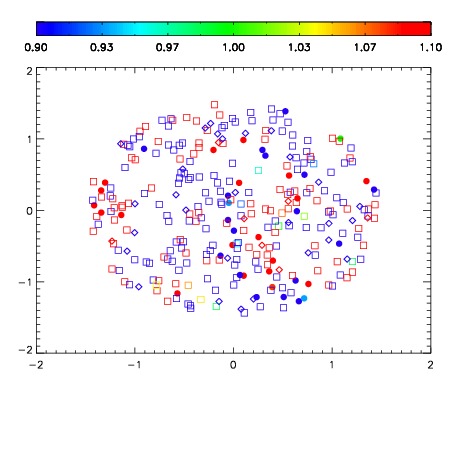
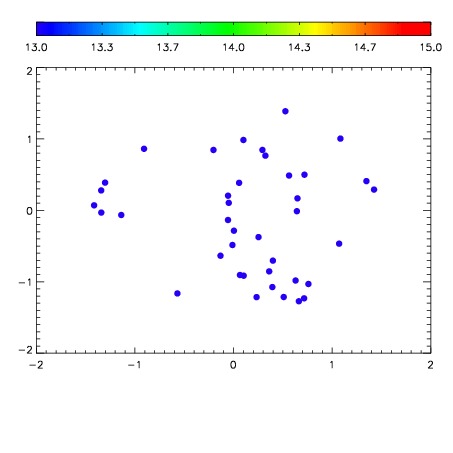

| Frame | Nreads | Zeropoints | Mag plots | Spatial mag deviation | Spatial sky 16325A emission deviations (filled: sky, open: star) | Spatial sky continuum emission | Spatial sky telluric CO2 absorption deviations (filled: H < 10) | |||||||||||||||||||||||
| 0 | 0 |
|
|
|
|
|
|
| IPAIR | NAME | SHIFT | NEWSHIFT | S/N | NAME | SHIFT | NEWSHIFT | S/N |
| 0 | 03070062 | 0.505863 | 0.00000 | 18.5285 | 03070056 | 0.00000 | 0.505863 | 18.3002 |
| 1 | 03070057 | 0.503867 | 0.00199604 | 18.8563 | 03070060 | 0.00347821 | 0.502385 | 18.8487 |
| 2 | 03070058 | 0.504594 | 0.00126898 | 18.7987 | 03070063 | 0.00568653 | 0.500176 | 18.7104 |
| 3 | 03070061 | 0.504561 | 0.00130200 | 18.5533 | 03070059 | 0.00698855 | 0.498874 | 18.6754 |