| Red | Green | Blue | |
| z | 17.64 | ||
| znorm | Inf | ||
| sky | -NaN | -NaN | -Inf |
| S/N | 26.9 | 45.1 | 47.4 |
| S/N(c) | 0.0 | 0.0 | 0.0 |
| SN(E/C) |
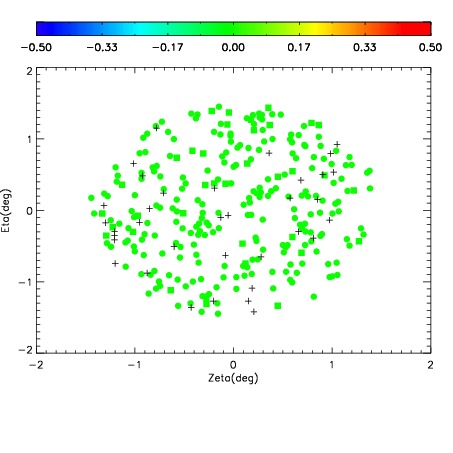
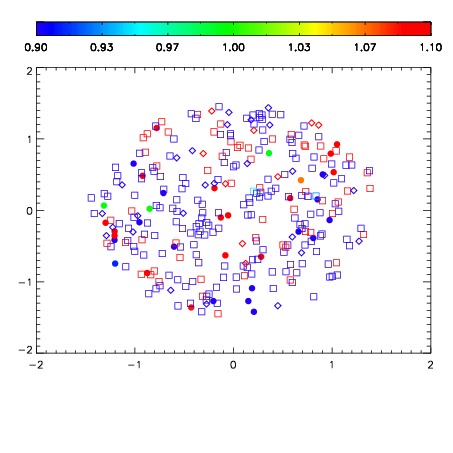
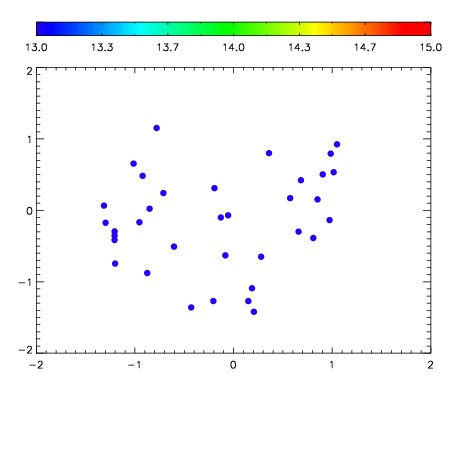

| Frame | Nreads | Zeropoints | Mag plots | Spatial mag deviation | Spatial sky 16325A emission deviations (filled: sky, open: star) | Spatial sky continuum emission | Spatial sky telluric CO2 absorption deviations (filled: H < 10) | |||||||||||||||||||||||
| 0 | 0 |
|
|
|
|
|
|
| IPAIR | NAME | SHIFT | NEWSHIFT | S/N | NAME | SHIFT | NEWSHIFT | S/N |
| 0 | 02900064 | 0.399837 | 0.00000 | 19.0686 | 02900061 | 0.00265772 | 0.397179 | 19.0505 |
| 1 | 02900063 | 0.397124 | 0.00271299 | 19.0719 | 02900058 | 0.00000 | 0.399837 | 19.0699 |
| 2 | 02900059 | 0.397184 | 0.00265297 | 19.0610 | 02900062 | 0.000480157 | 0.399357 | 19.0101 |
| 3 | 02900060 | 0.399187 | 0.000649989 | 19.0495 | 02900065 | 0.00183751 | 0.397999 | 19.0067 |