| Red | Green | Blue | |
| z | 17.64 | ||
| znorm | Inf | ||
| sky | -NaN | -NaN | -Inf |
| S/N | 23.9 | 42.1 | 43.9 |
| S/N(c) | 0.0 | 0.0 | 0.0 |
| SN(E/C) |
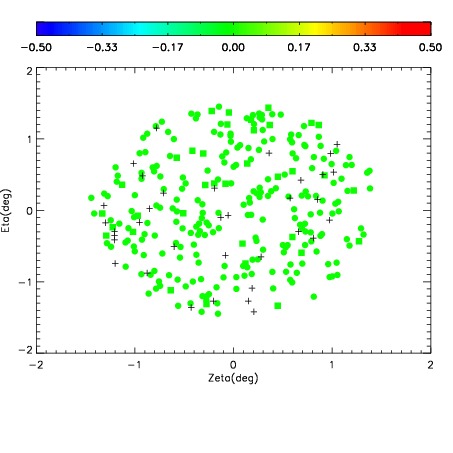
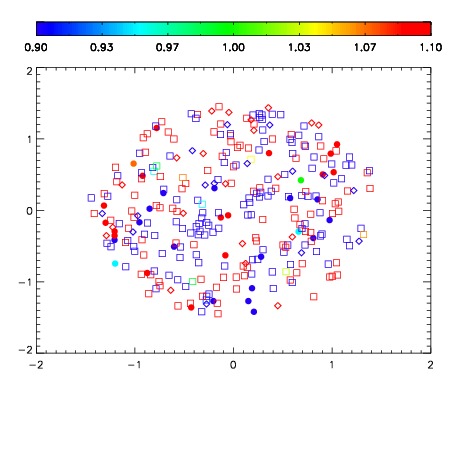
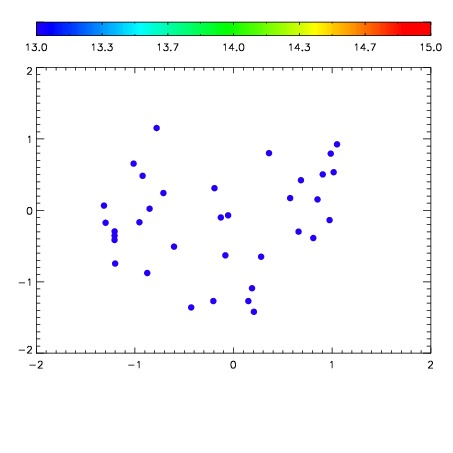

| Frame | Nreads | Zeropoints | Mag plots | Spatial mag deviation | Spatial sky 16325A emission deviations (filled: sky, open: star) | Spatial sky continuum emission | Spatial sky telluric CO2 absorption deviations (filled: H < 10) | |||||||||||||||||||||||
| 0 | 0 |
|
|
|
|
|
|
| IPAIR | NAME | SHIFT | NEWSHIFT | S/N | NAME | SHIFT | NEWSHIFT | S/N |
| 0 | 03090058 | 0.488122 | 0.00000 | 19.0020 | 03090056 | 0.00000 | 0.488122 | 18.9743 |
| 1 | 03090057 | 0.487205 | 0.000916988 | 18.9023 | 03090063 | 0.00192824 | 0.486194 | 18.8913 |
| 2 | 03090062 | 0.486578 | 0.00154400 | 18.6998 | 03090059 | 0.00139377 | 0.486728 | 18.8468 |
| 3 | 03090061 | 0.486398 | 0.00172397 | 18.5710 | 03090060 | 0.000167715 | 0.487954 | 18.7153 |