| Red | Green | Blue | |
| z | 17.64 | ||
| znorm | Inf | ||
| sky | -Inf | -Inf | -Inf |
| S/N | 30.9 | 50.9 | 54.4 |
| S/N(c) | 0.0 | 0.0 | 0.0 |
| SN(E/C) |
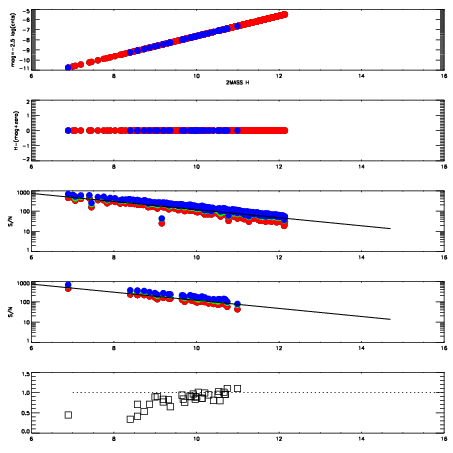
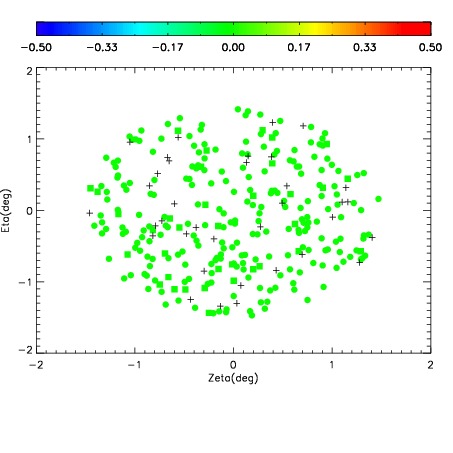
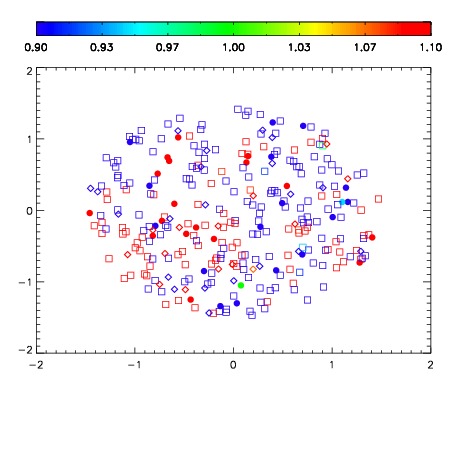
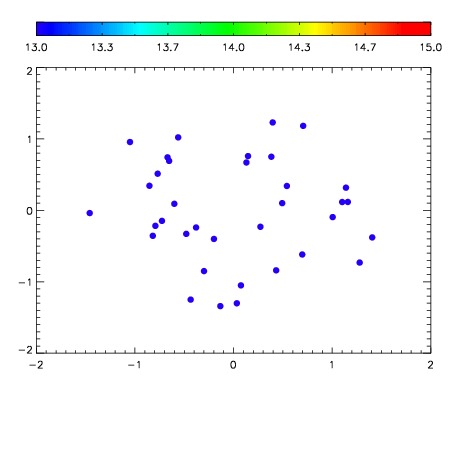

| Frame | Nreads | Zeropoints | Mag plots | Spatial mag deviation | Spatial sky 16325A emission deviations (filled: sky, open: star) | Spatial sky continuum emission | Spatial sky telluric CO2 absorption deviations (filled: H < 10) | |||||||||||||||||||||||
| 0 | 0 |
|
|
|
|
|
|
| IPAIR | NAME | SHIFT | NEWSHIFT | S/N | NAME | SHIFT | NEWSHIFT | S/N |
| 0 | 03710067 | 0.502125 | 0.00000 | 19.2455 | 03710065 | 0.00000 | 0.502125 | 19.2184 |
| 1 | 03710066 | 0.496281 | 0.00584403 | 19.2235 | 03710068 | 0.00165274 | 0.500472 | 19.2097 |
| 2 | 03710071 | 0.501518 | 0.000607014 | 19.1968 | 03710069 | -0.000439120 | 0.502564 | 19.1980 |
| 3 | 03710070 | 0.500054 | 0.00207102 | 19.1716 | 03710072 | -0.000156288 | 0.502281 | 19.1543 |