| Red | Green | Blue | |
| z | 17.64 | ||
| znorm | Inf | ||
| sky | -Inf | -Inf | -Inf |
| S/N | 28.5 | 49.0 | 53.0 |
| S/N(c) | 0.0 | 0.0 | 0.0 |
| SN(E/C) |
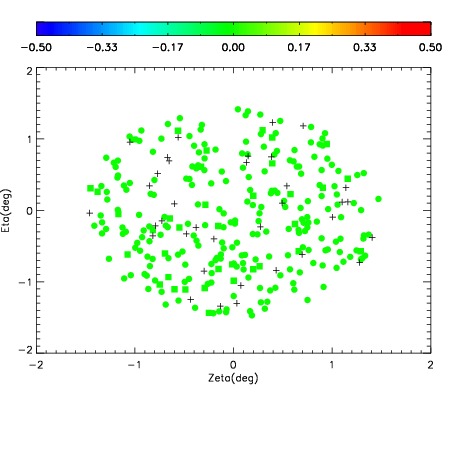
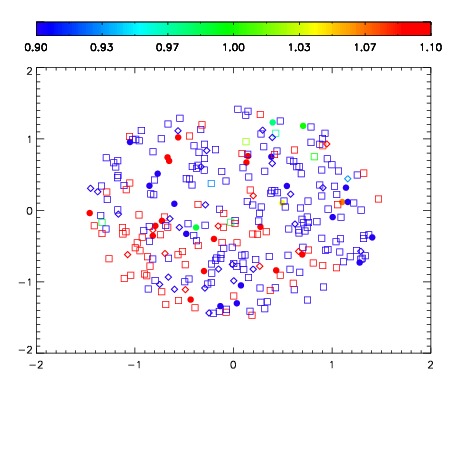
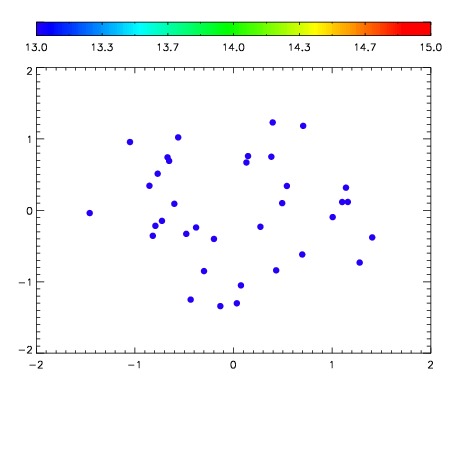

| Frame | Nreads | Zeropoints | Mag plots | Spatial mag deviation | Spatial sky 16325A emission deviations (filled: sky, open: star) | Spatial sky continuum emission | Spatial sky telluric CO2 absorption deviations (filled: H < 10) | |||||||||||||||||||||||
| 0 | 0 |
|
|
|
|
|
|
| IPAIR | NAME | SHIFT | NEWSHIFT | S/N | NAME | SHIFT | NEWSHIFT | S/N |
| 0 | 06730076 | 0.488517 | 0.00000 | 19.2218 | 06730077 | -0.000880046 | 0.489397 | 19.2289 |
| 1 | 06730075 | 0.486217 | 0.00229999 | 19.2332 | 06730074 | 0.00169969 | 0.486817 | 19.2290 |
| 2 | 06730072 | 0.488232 | 0.000285000 | 19.2100 | 06730073 | 0.00390685 | 0.484610 | 19.2150 |
| 3 | 06730071 | 0.483498 | 0.00501898 | 19.1964 | 06730070 | 0.00000 | 0.488517 | 19.2005 |